When the waste has nowhere to hide
Geotab uncovers waste so you can lower fuel and maintenance costs, reduce risk, and tighten operations.

Every one of those levers is measured by the same platform you would install for tracking alone.
Where the Money Is
What gets measured gets managed. Geotab puts numbers on the leaks.
See exactly where fuel burns without moving anyone forward.
Right-size the fleet and stop paying for vehicles that sit.
Fewer miles for the same work, week after week.
Safer driving lowers claims, repairs, and premiums over time.

In MyGeotab
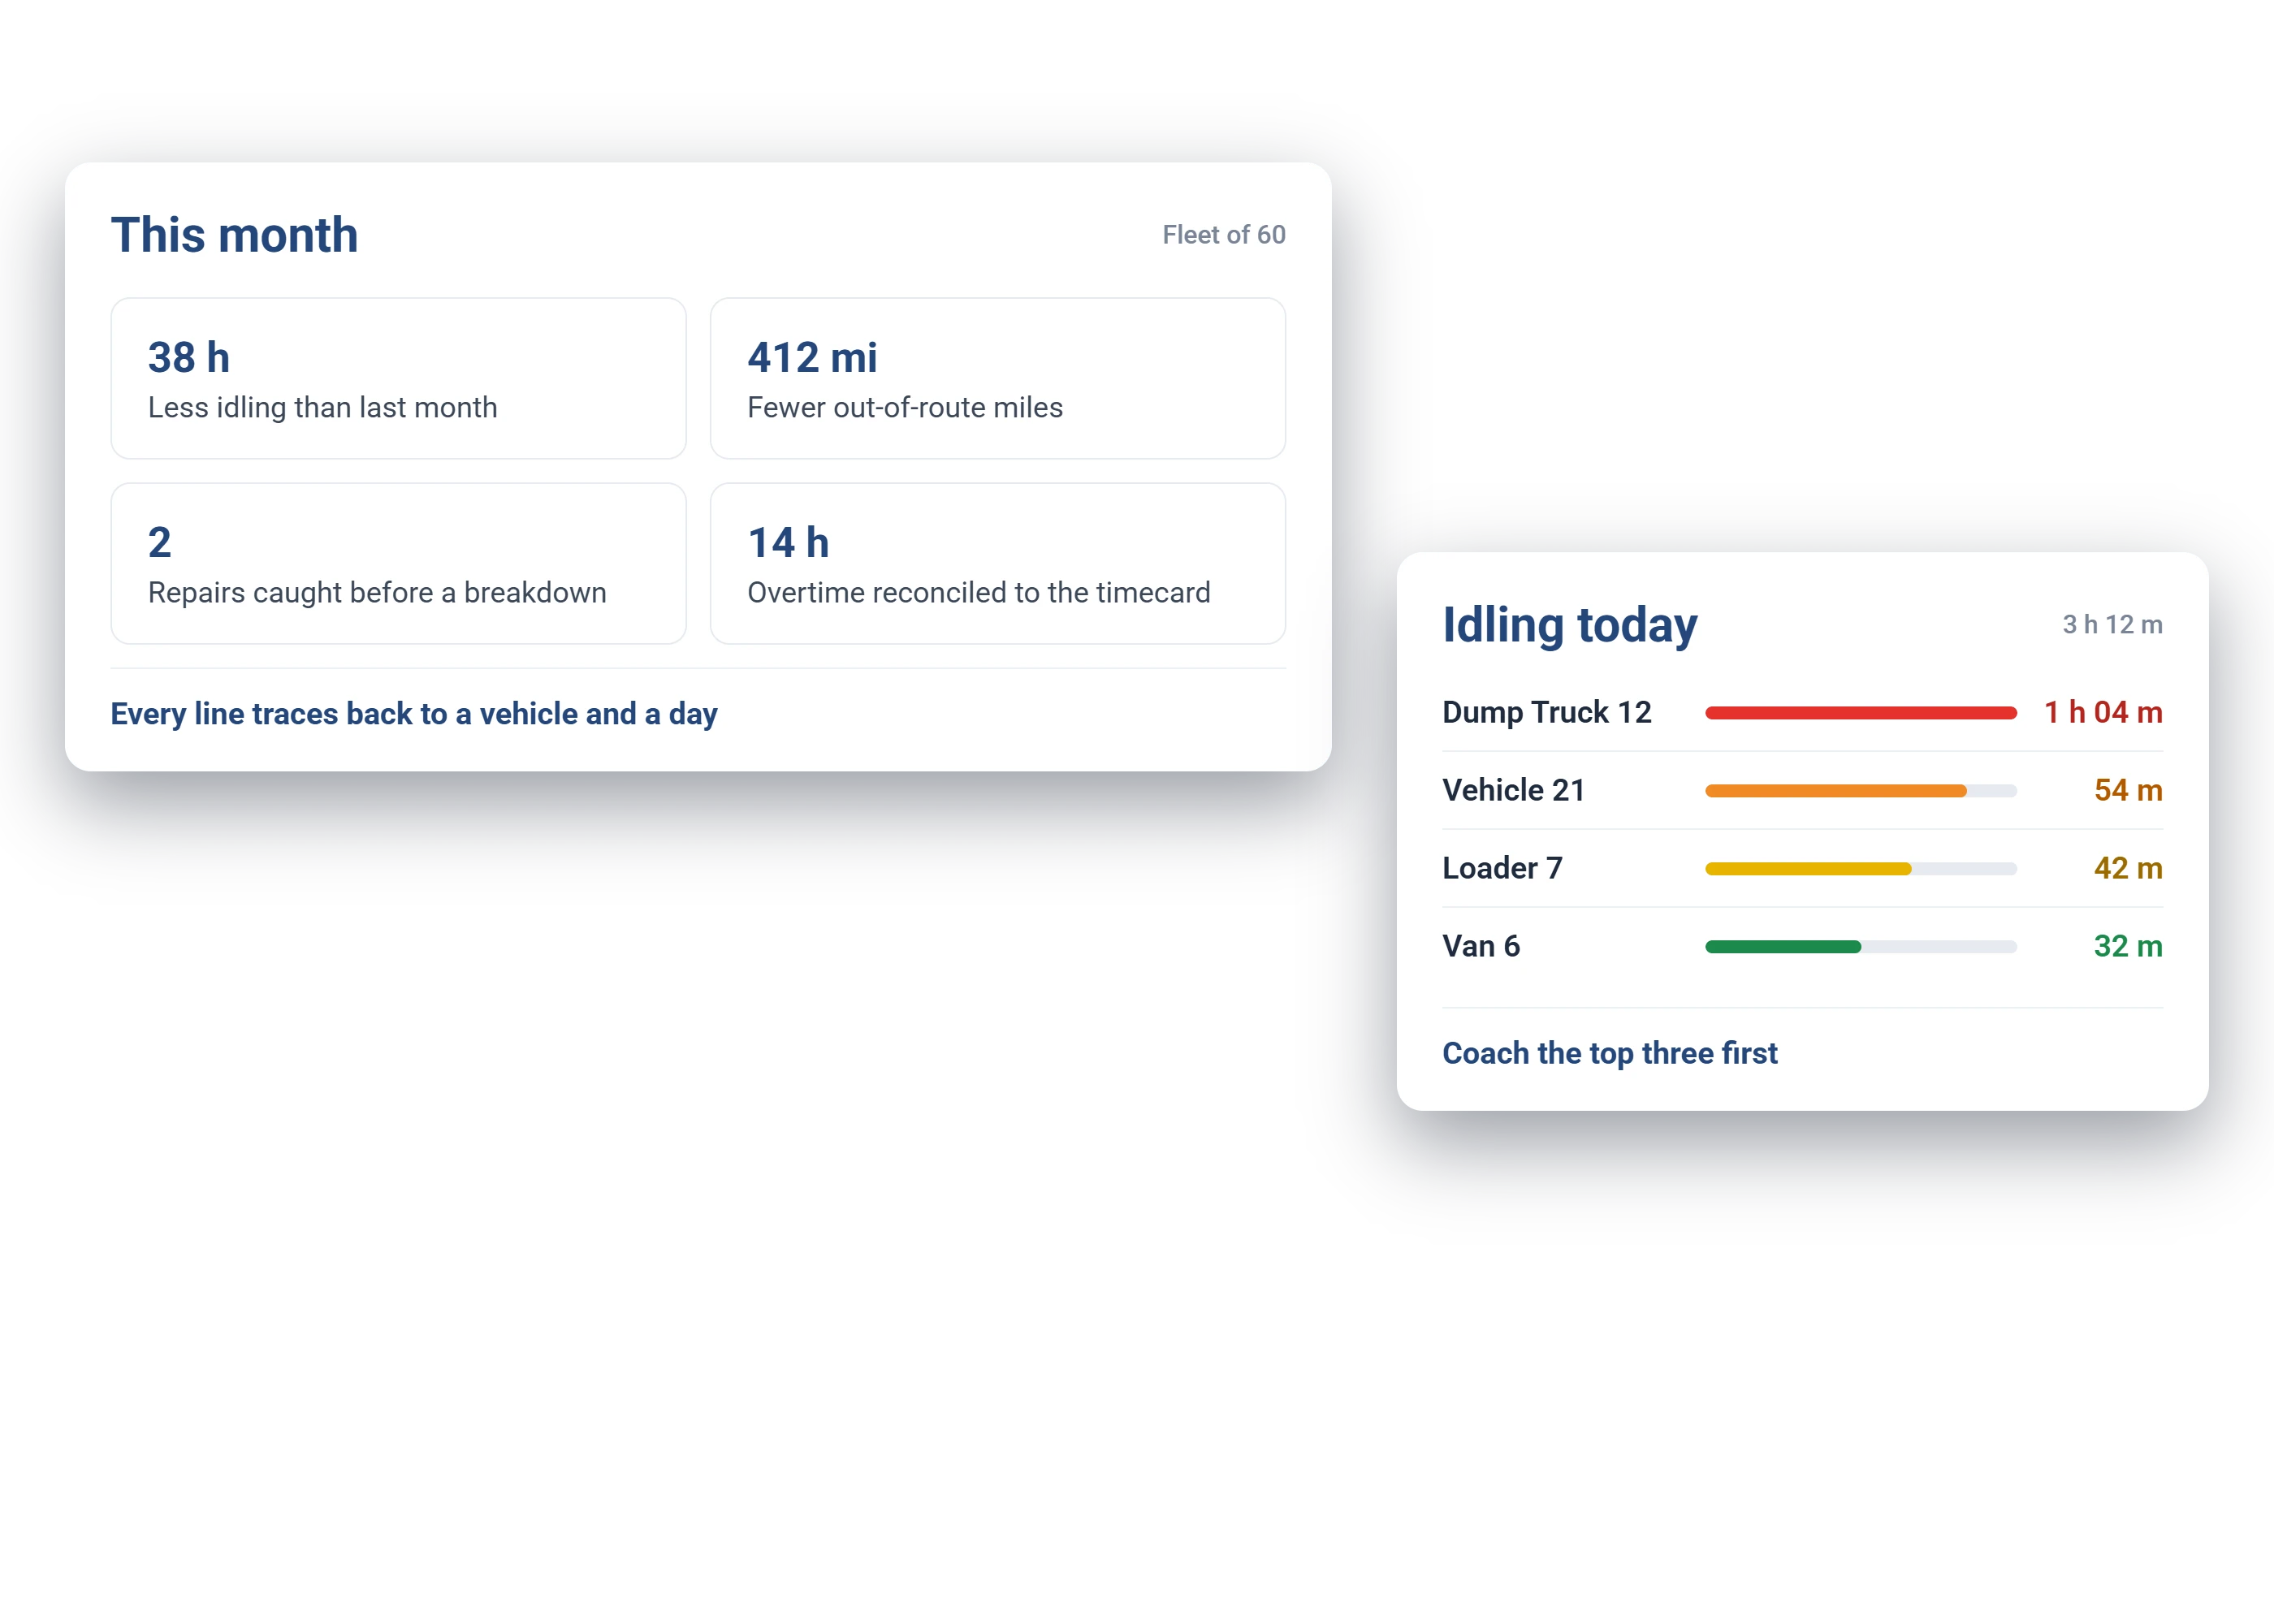
Idle cost, utilization, and fuel trends on one dashboard, so the first month shows where the money goes.
Savings Estimator
Set the sliders to match your fleet and see what trimming idle time alone could return. Fuel is only the first leak Geotab finds.
Set it to your local pump price. The rest is prefilled with fleet averages, about 120 gallons per vehicle a month and roughly 20% of fuel burned at idle.
Give idle time a number and coach it, and most fleets watch it fall. The estimate above is illustrative, not a promise.
Illustrative estimate from your inputs only, not a quote or a guarantee. It counts fuel savings from reduced idling alone, before routing, utilization, maintenance, or insurance gains.
What Changes
Five Leaks, One Meter
Usually visible in the first two weeks of data, with no process change required. The preventable kind, events running 10 to 60 minutes, gets split out from operational idling automatically, so you coach what can actually change.
Route optimization attacks the same work with fewer miles.
Predictive health signals move repairs from the roadside to the bay, where they cost a fraction as much. When one happens anyway, roadside assistance built into Geotab gets help rolling.
Safer driving trims claims, and documented safety data changes insurance conversations at renewal (see Insurance Savings & Risk Reduction).
Utilization data finds the vehicles that sit. The cheapest vehicle to run is the one you stop paying for.
What we do with your first 30 days of data. During a demo we put devices on a slice of your fleet and walk the waste line by line: idle hours by vehicle, miles versus work done, faults already brewing. Your own numbers, not an industry average, before you commit.
A closer look
These are the screens that turn fleet activity into line items you can act on.

Idle time ranked by vehicle, driver, and location, with the fuel cost attached to each.
Fill-ups matched to distance and activity, so off-hours burn and skimming stand out.
Days used, hours driven, and idle-only days per asset, the data behind a right-sizing call.
Actual routes and stop times, the baseline you compare any optimized plan against.
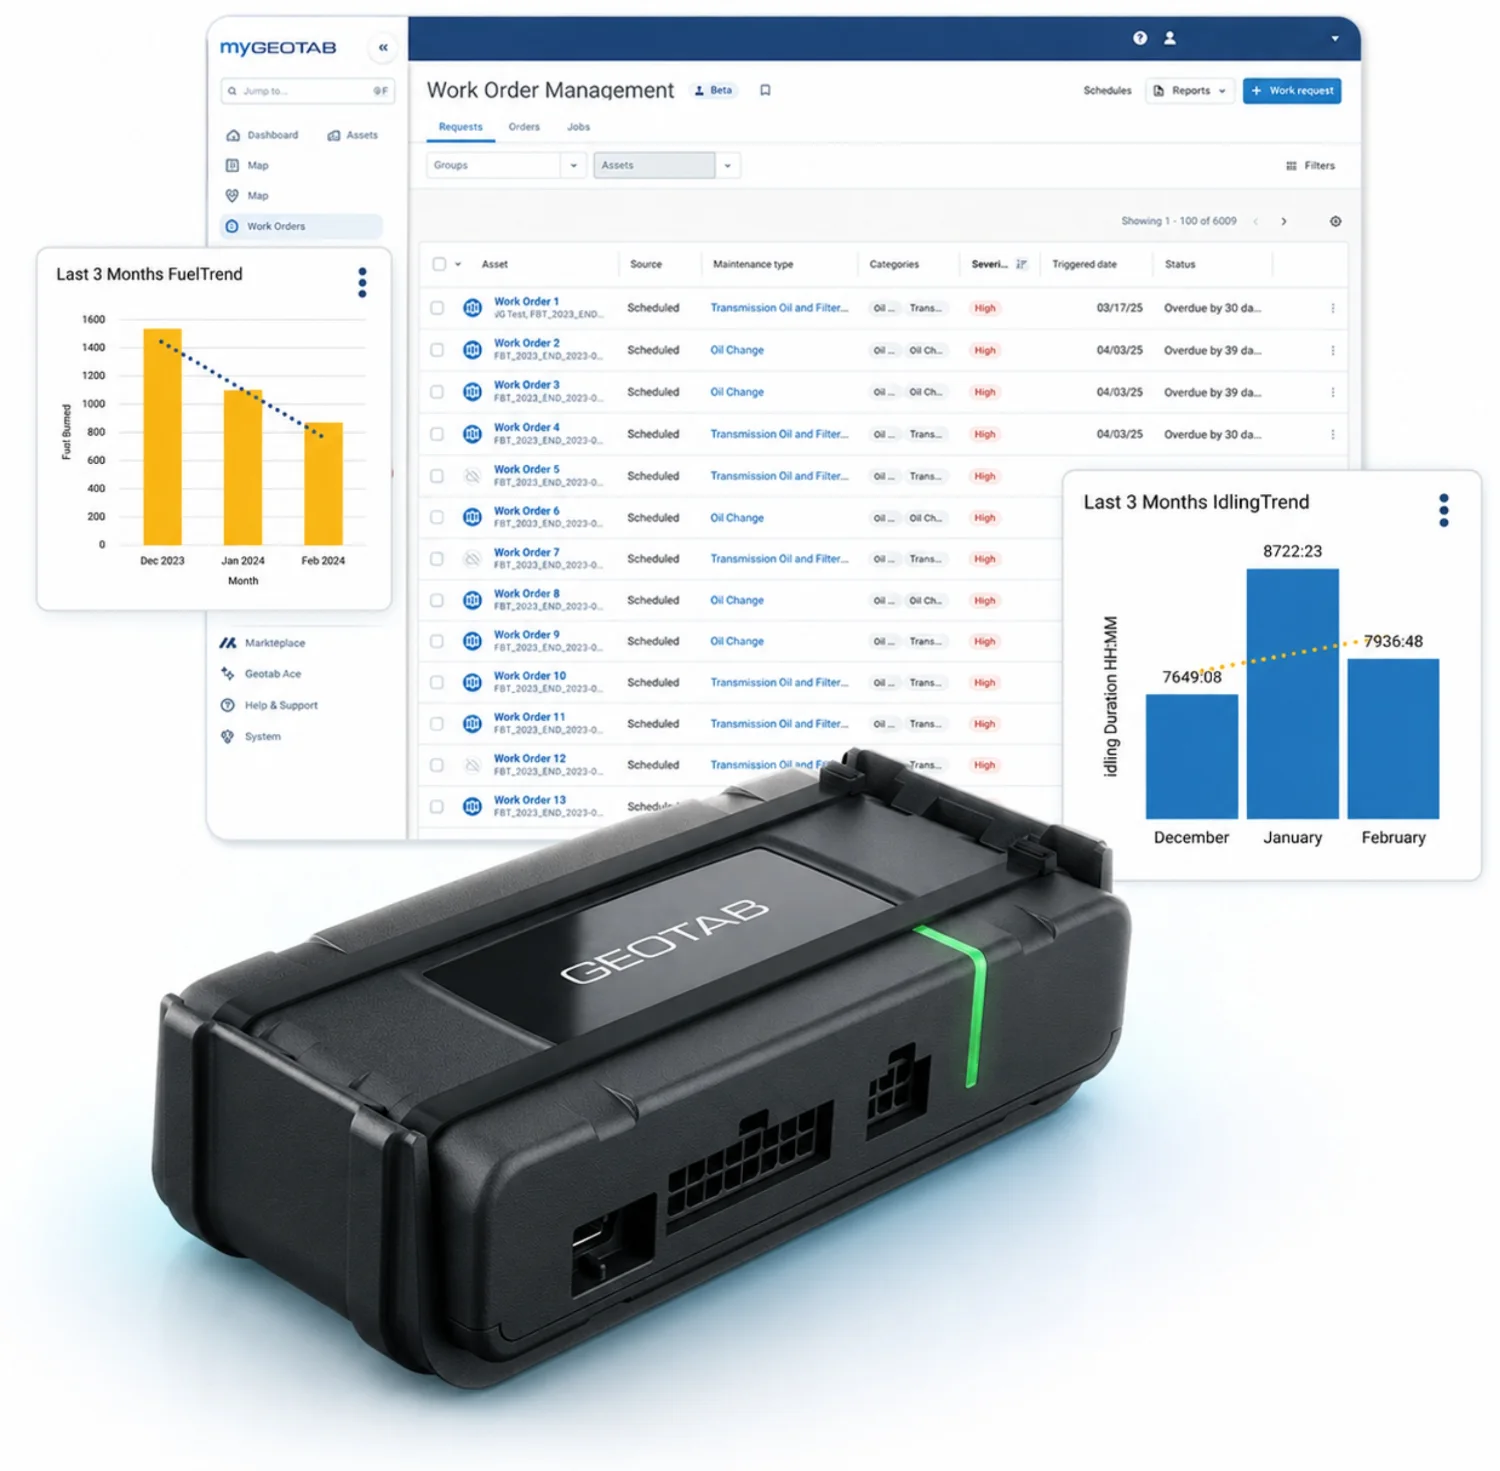
Fault codes and service reminders that move a repair from the roadside to the bay.
The recovered-cost figures packaged and emailed to leadership on a set cadence.
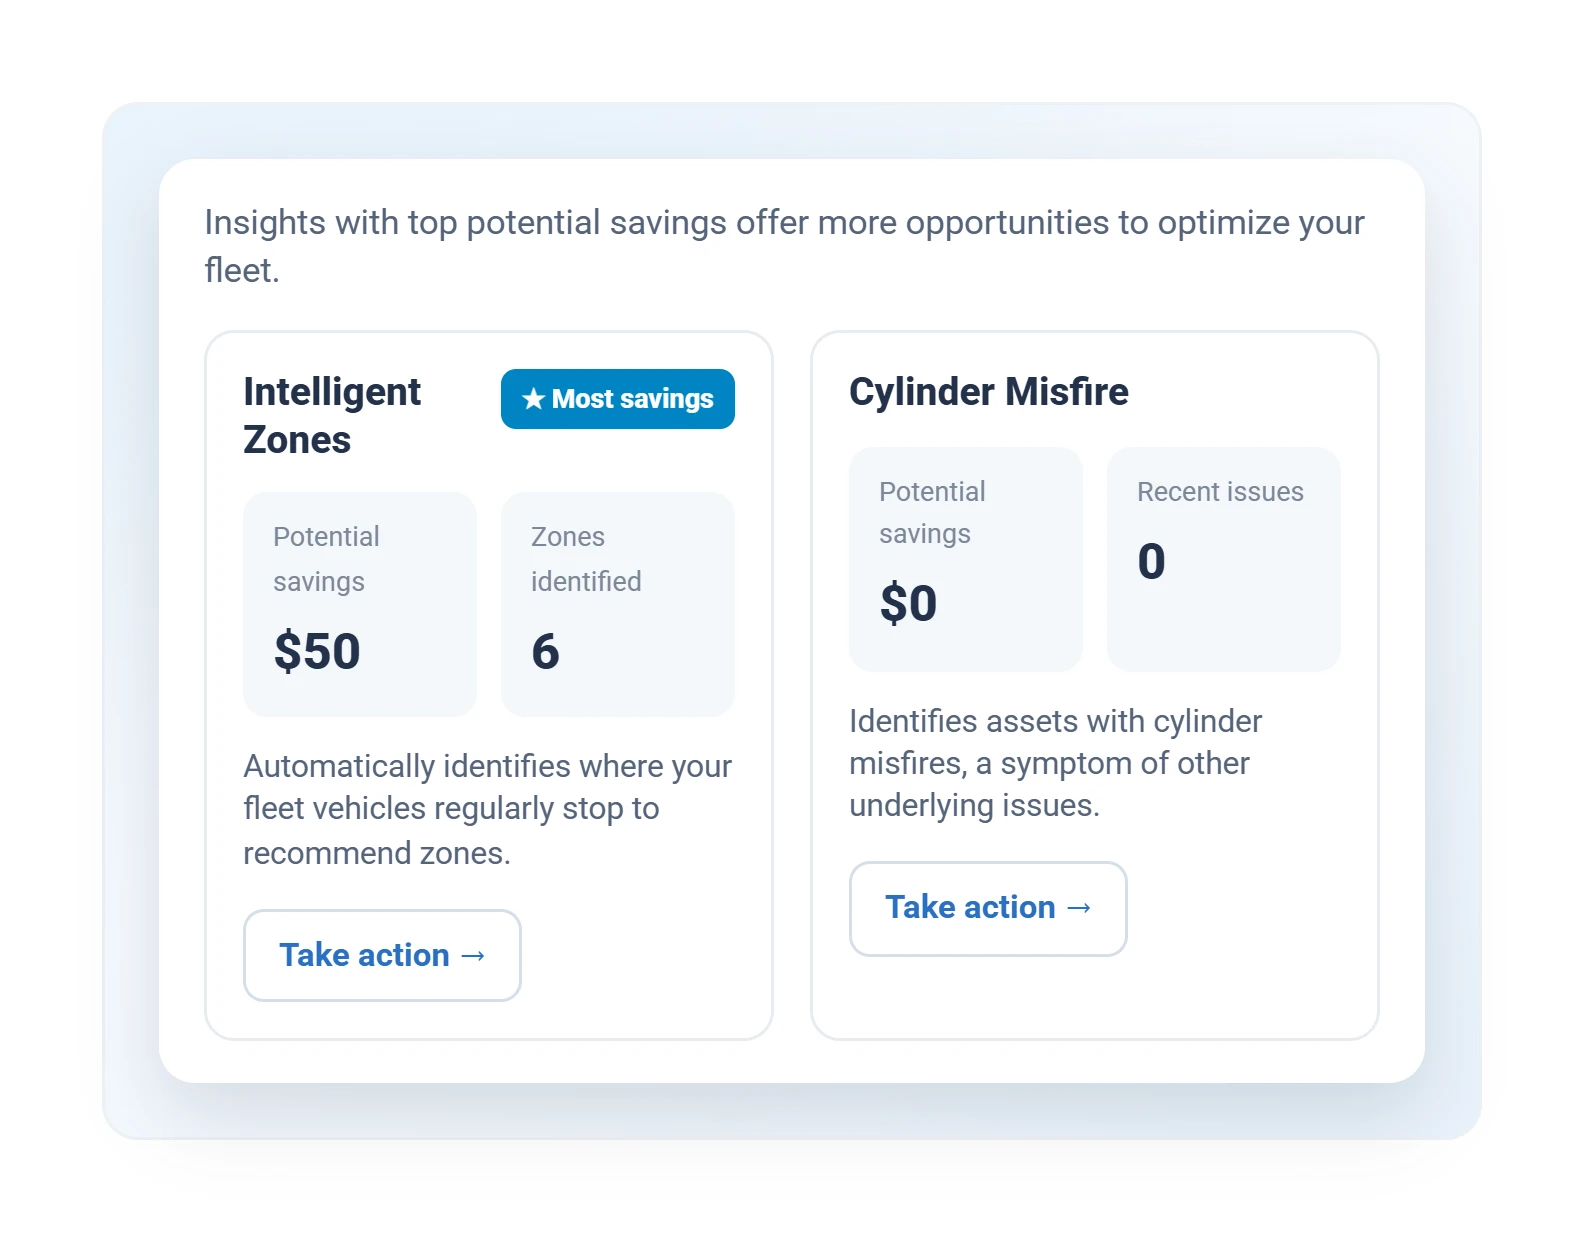
Active Insights
MyGeotab surfaces the biggest recoverable costs first, with the action attached.
Questions
Less idling and fuel waste, fewer breakdowns through proactive maintenance, tighter routing, and reduced unauthorized use.
Most fleets see idling fall once it is visible and coached, because the preventable share finally has names and numbers attached. Your results depend on your fleet and how the tools are used.
Fast. A free demo puts devices on a few of your vehicles, and the first waste, usually idling and after-hours use, surfaces within about two weeks.
Idling and after-hours use, because they need only visibility and no process change. Routing, maintenance, and insurance gains build over the following quarters as the tools get used.
No, and be suspicious of anyone who guarantees them. The 15-30% mileage and 2-3 extra jobs per day figures are Geotab's own playbook claims (2025), not something GPSFMS will put in writing for your fleet in advance.
The opposite works better. Geotab’s rewards-based Vitality program pays drivers to drive smoother instead of writing them up for driving rough, and fuel efficiency follows.
“We found so much time wasted in every vehicle, and with every driver. It took us literally one week to understand the impact and reality of our return. We are saving 40 to 45% on overtime payroll, over $18,000 per month. It is truly amazing.”T&D Solutions, Alexandria, LA
Keep exploring
Inside MyGeotab
Distance, hours, and days used per asset, so underused equipment stands out.
Illustrative MyGeotab screen with fictional data
Run a free demo on a few vehicles and we will show you the waste in the first week of data.