“We saw $5,500 in fuel savings in the first month. The impact was much greater than we expected. It was shocking!”The Fence Company, Raleigh, NC
That was one month in. Fuel spend is easy to see on the statement and hard to explain line by line, so the waste stays hidden until every gallon carries a vehicle, a driver and a place.
Fleet fuel costs leak in three places: engines idling with nowhere to go, miles a better route would never drive, and pump purchases nobody checks. For a multi-site fleet, or an agency answering for every gallon, Geotab covers all three on one platform. Here is how it closes each one, which MyGeotab screens show the number, and how to build the case on your own vehicles.
ROI at a glance
Fleet Idling, Ranked by Vehicle, Driver and Location
Idling is fuel burned at zero miles per hour. On a fuel statement, an idle gallon looks exactly like a working one.
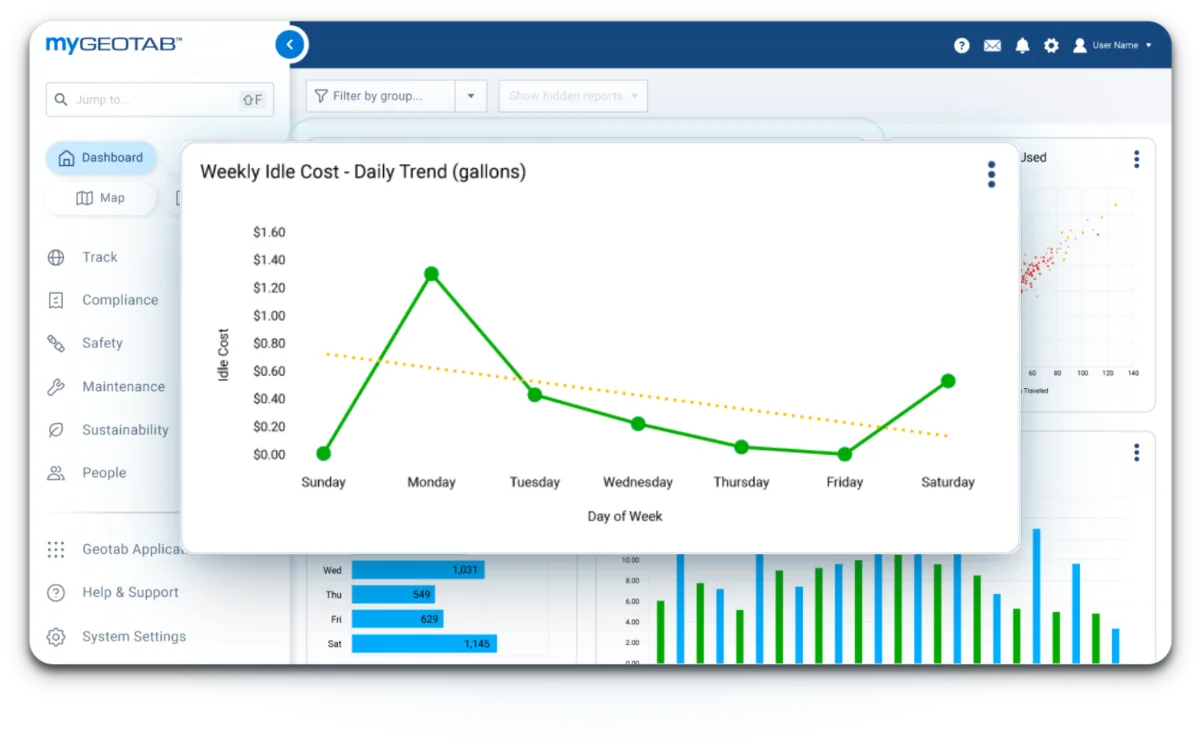
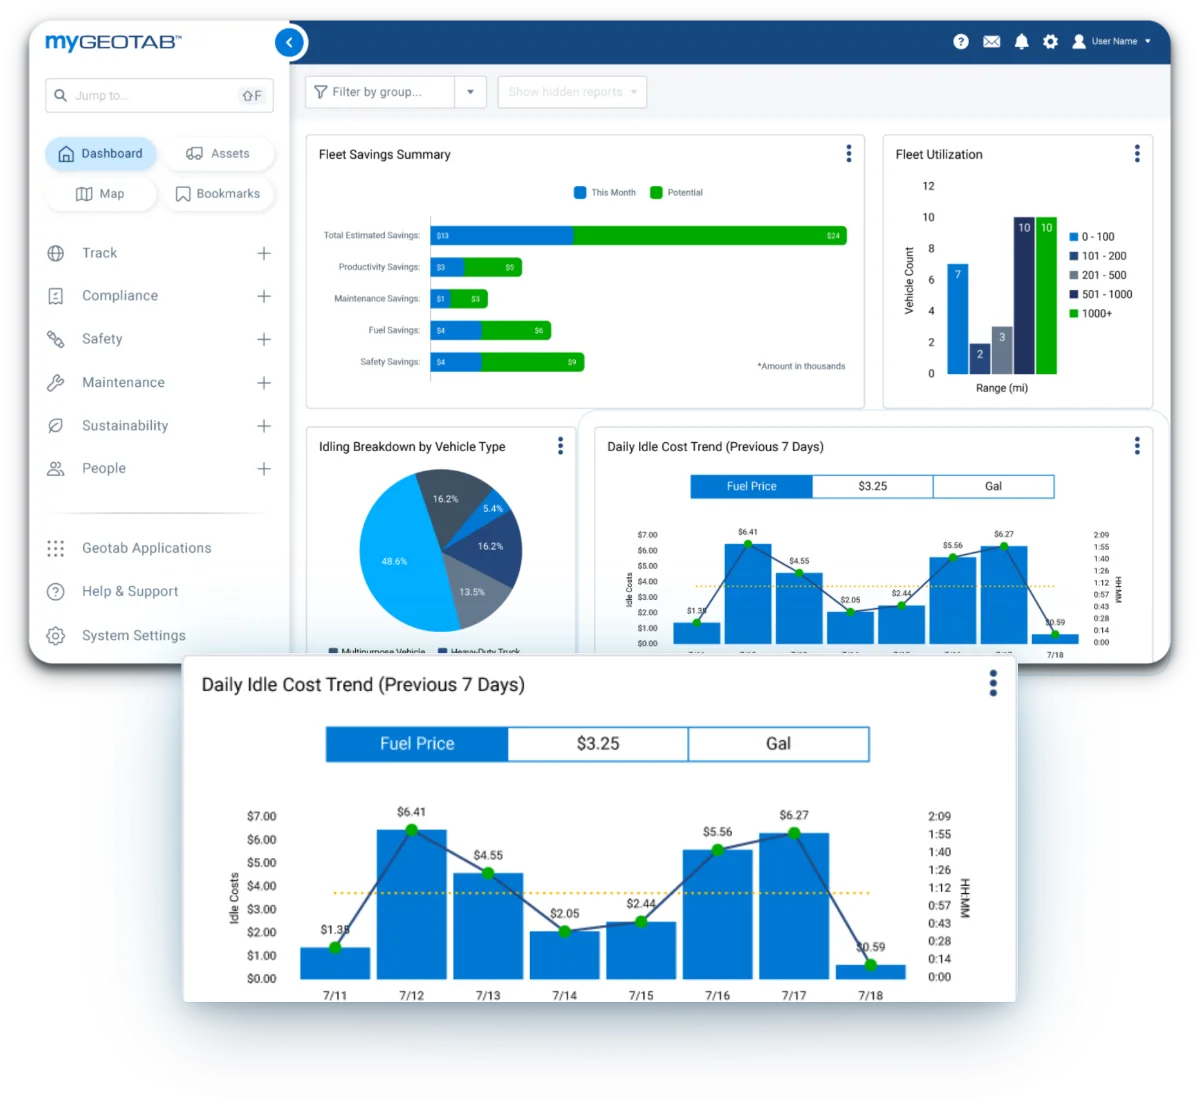
The Idling Report in MyGeotab ranks idle time by vehicle, driver and location, with the fuel cost attached to each. Preventable idling is split out from warm-ups and PTO work automatically, so you coach what can change.
For a utility, a public works department or a food and beverage distributor running trucks from several yards, that ranking turns a fleet-wide problem into a short list of names. Scheduled reports email the same ranking to leadership, so the fuel conversation starts with names and numbers.
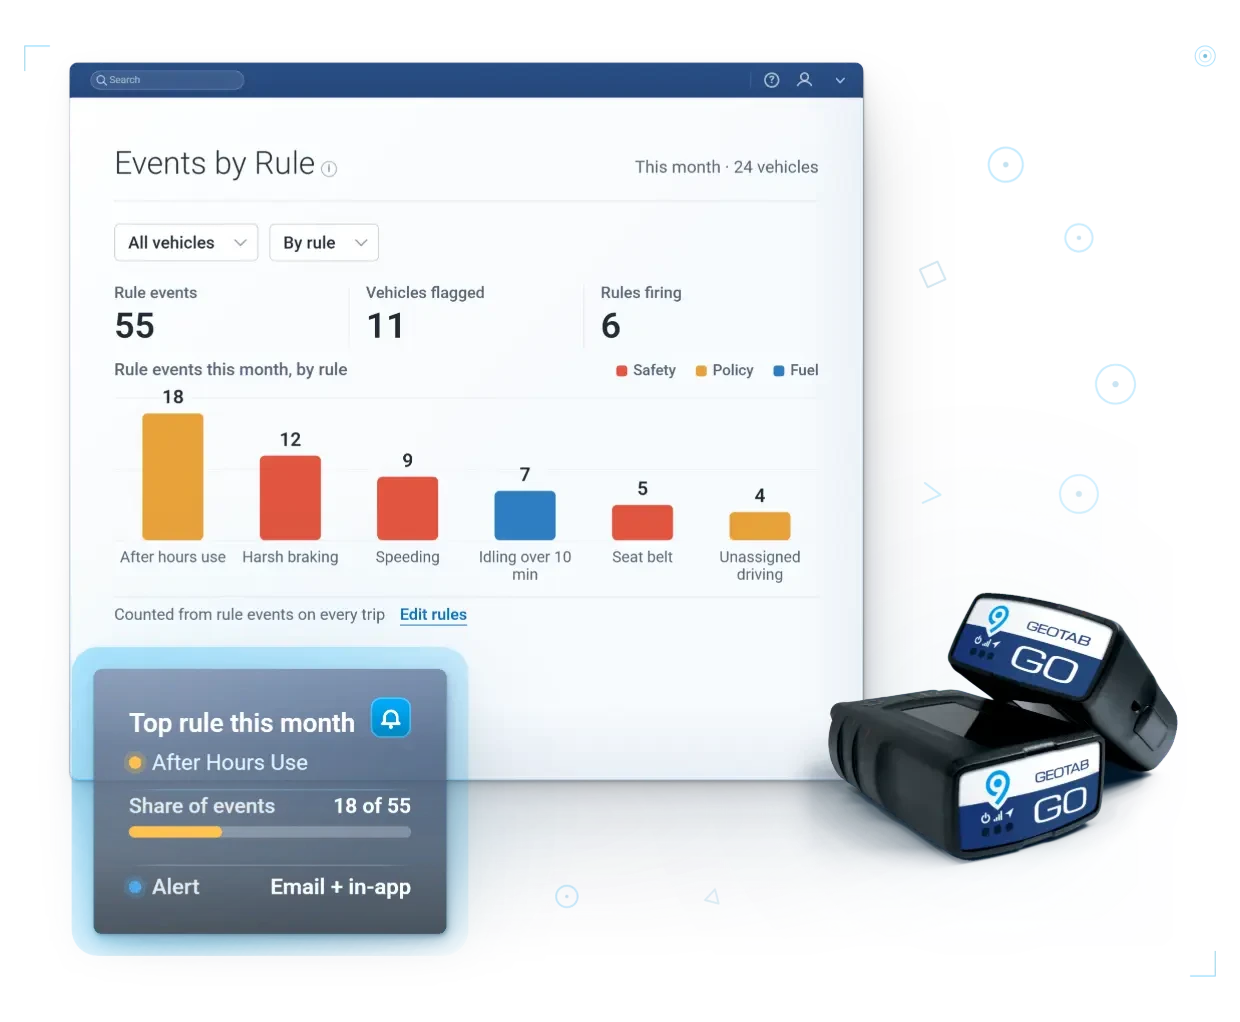
Coaching does not have to wait for the weekly report. Idling alerts reach the driver in the cab as it happens, and a rule can notify the driver at once and the supervisor on the third event, so most idle habits end with the driver. Rules also combine conditions, such as idling plus location, so the alert fires where idle time costs you most.
Driving style moves the fuel line too. Geotab reports 2.7% better fuel efficiency at Richards Building Supply and 6.4% at King Township with driver rewards.
Idling counts toward each driver's score alongside speeding, harsh braking and acceleration, cornering and seatbelt use, so the drivers who idle least climb a leaderboard the whole fleet can see.
What Fleet Idling Costs at Your Own Pump Price
An industry average tells you little about your own fuel bill. Every fleet runs a different mix of vehicles, routes and pump prices.
Put your own fleet size, pump price and idling target into the idling calculator on our fleet fuel management and cost savings page.
The estimate counts reduced idling alone, before any routing, utilization, maintenance or insurance gains, so treat it as a floor. A free demo device then shows your real idle time, on your own vehicles, in MyGeotab.
Reduce Fleet Fuel Costs by Driving Fewer Miles
The cheapest gallon is the one a route never needs. Geotab reports 15 to 30% fewer miles for fleets on Geotab Routing & Optimization.
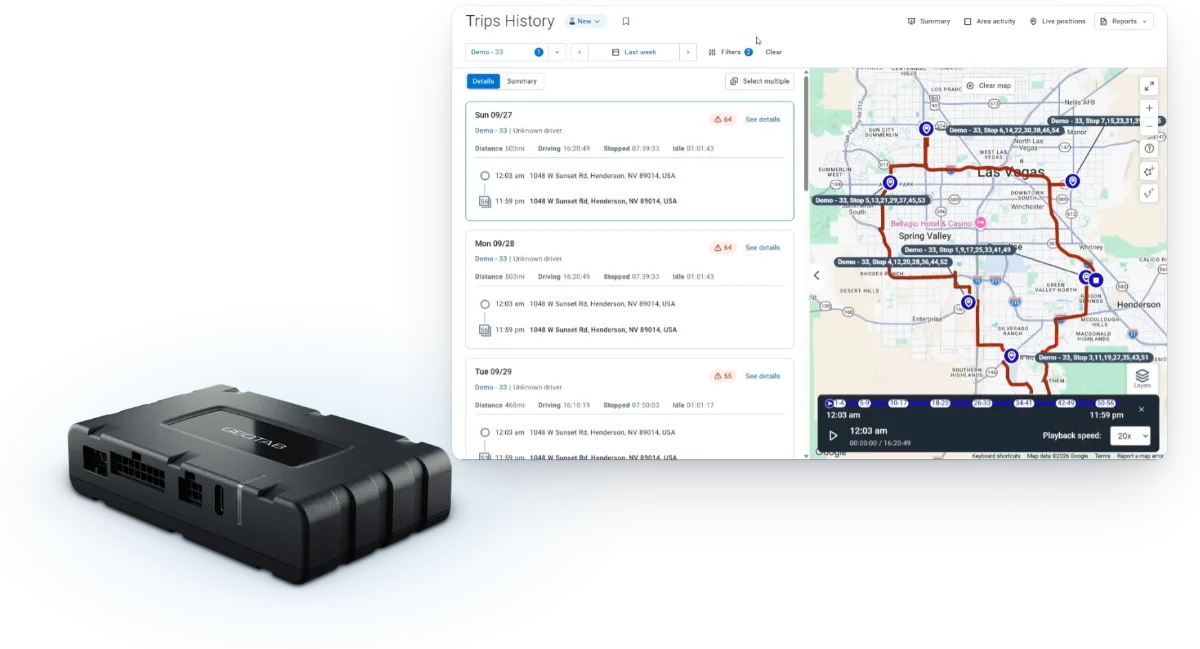
The first miles to cut are the ones you already drive. Trips History shows actual routes and stop times, ready to compare, so a long way around or an unplanned stop shows up trip by trip. Live dispatch shows who is closest, who is running late and who is free next, so the nearest truck takes the next call.
Then come the miles nobody approved. An after-hours rule flags a vehicle the moment it moves outside the shift, so personal trips surface as they happen, not on next month's fuel bill.
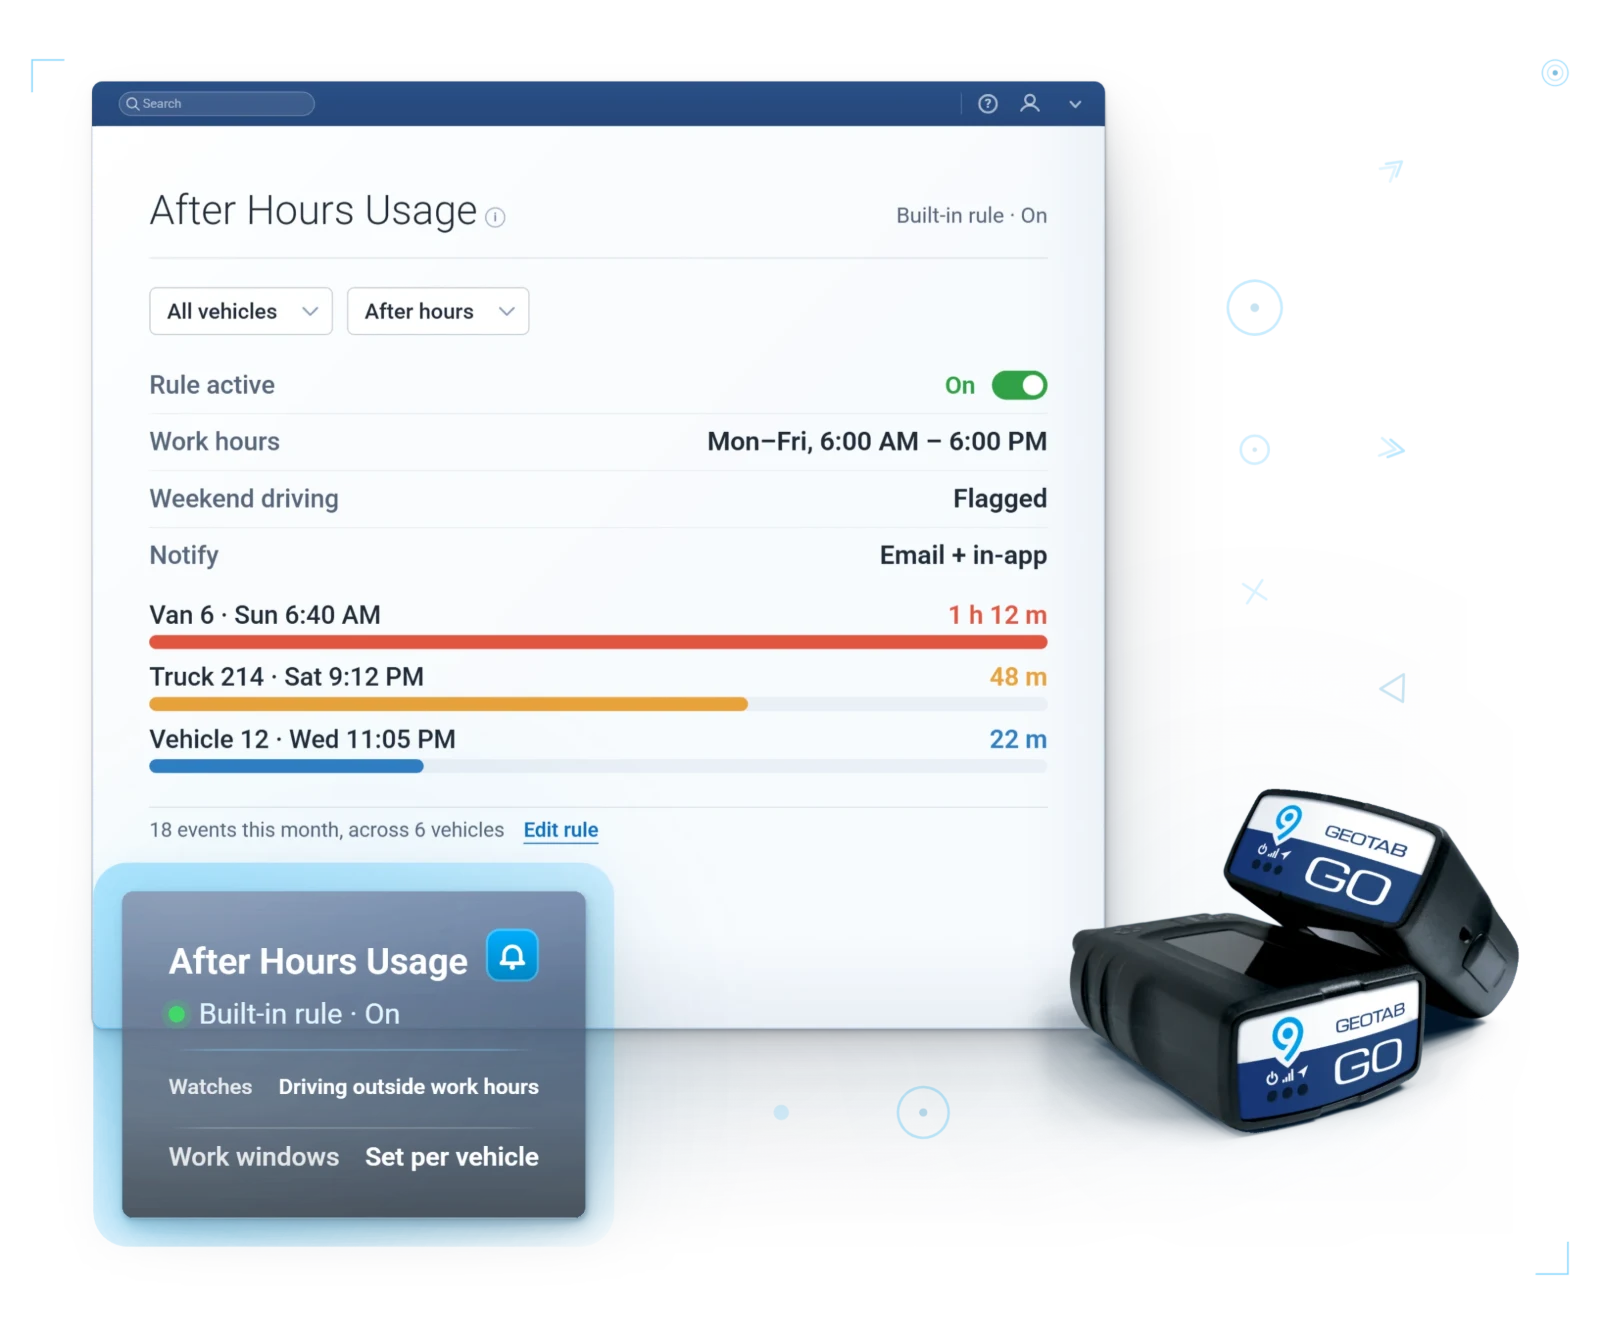
Below about five stops per driver per day, built-in dispatch covers you. Above it, we add route optimization. Fuel cost and wear factor into every optimized route, and Plan vs Actual checks planned miles against the miles actually driven. See how Geotab fleet routing and dispatch works.
Every Fuel-Card Purchase Matched to the Vehicle That Fueled
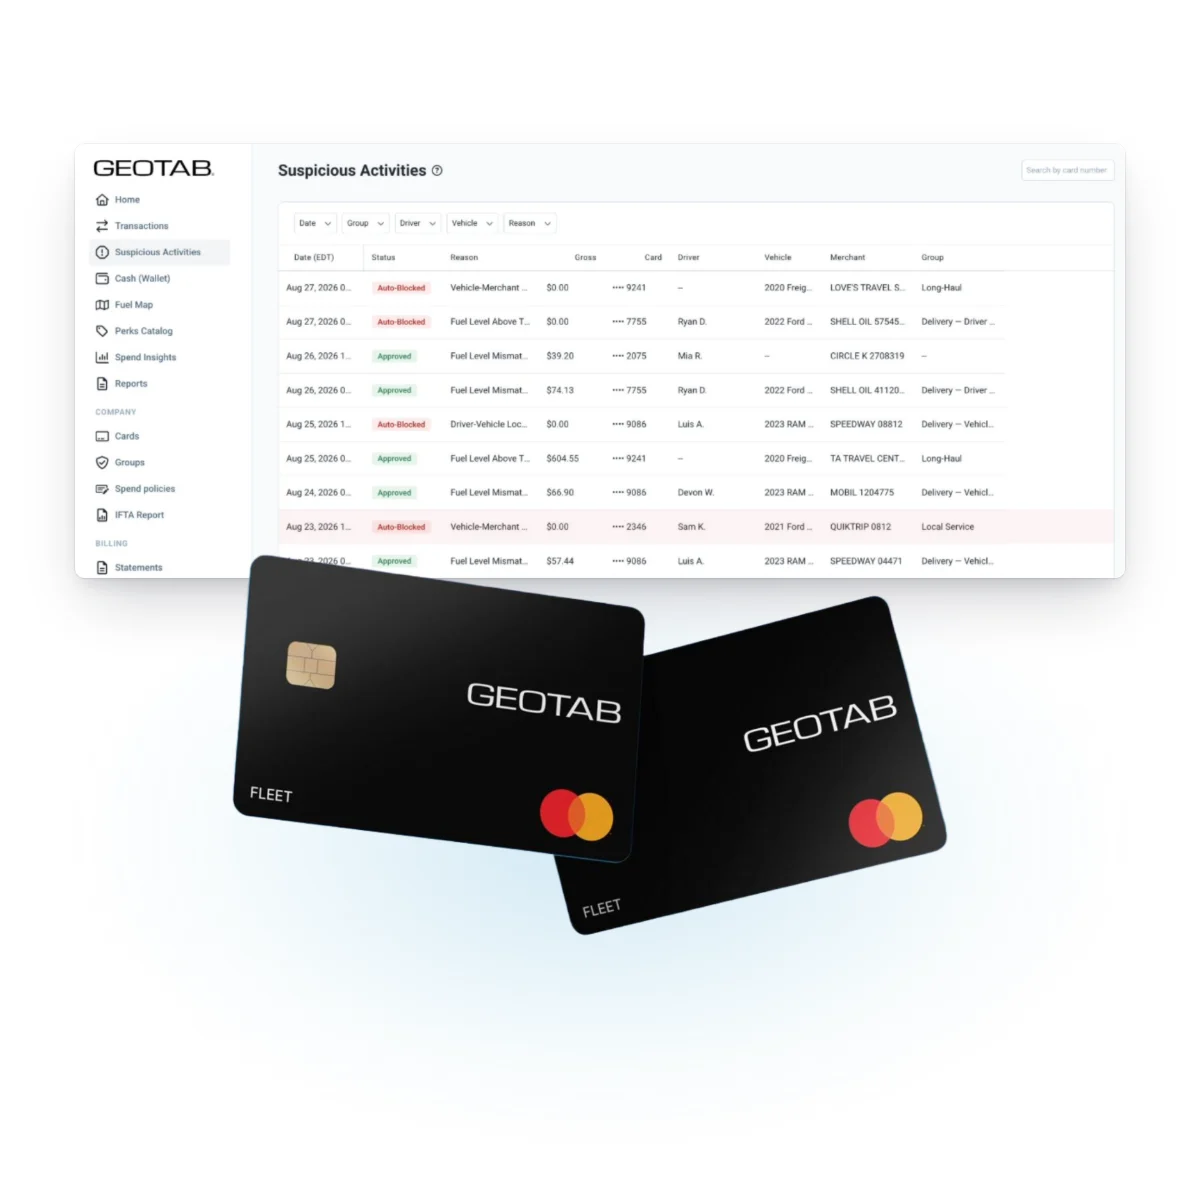
The pump is where fuel spend leaves the building, one swipe at a time. Fuel Transactions matches every fuel-card purchase to the vehicle and flags location, tank-size and fuel-type mismatches for review.
Your team reviews a short list of flagged purchases, each with the vehicle attached, instead of a whole statement. For a public fleet answering to a council or an auditor, that record sits in the same MyGeotab login your team uses for tracking, safety and maintenance.
Geotab Fleet Card: Pump-Side Checks and Fuel Discounts
The Geotab Fleet Card moves the check to the pump itself. The card stays locked until the driver unlocks it in the Geotab Drive app with the assigned vehicle present. The vehicle's GPS location is matched to the station and a live fuel-level check confirms the tank has room, or the charge is declined.
Blocking a bad charge protects the budget. The discounts lower the price of every good one.
The Geotab Fleet Card carries fuel discounts at 34,000+ U.S. locations, including 42¢ a gallon in diesel savings at 4,200+ truck stops (late-2025 average). There is $0 in card fees: no activation fee, no monthly fee and no transaction fee.
Find Fuel in the Geotab Drive app shows in-network stations with live, discounted prices, so drivers find the cheapest pump before the exit. Spend Insights in MyGeotab then ranks every driver on price per gallon, so you see who beats the market price and who does not.
Set card rules by dollar amount, time, location and merchant category, with IFTA in MyGeotab. Verified purchases are backed by a fraud guarantee of up to $250,000 for eligible accounts.
The Geotab Fleet Card is for U.S. fleets, with each card tied to a telematics-equipped vehicle, and fleets apply in MyGeotab. Read how the Geotab Fleet Card stops fuel fraud at the pump, or see our Geotab Fleet Card page.
Fleet Fuel Reports in MyGeotab: Where the Savings Show Up
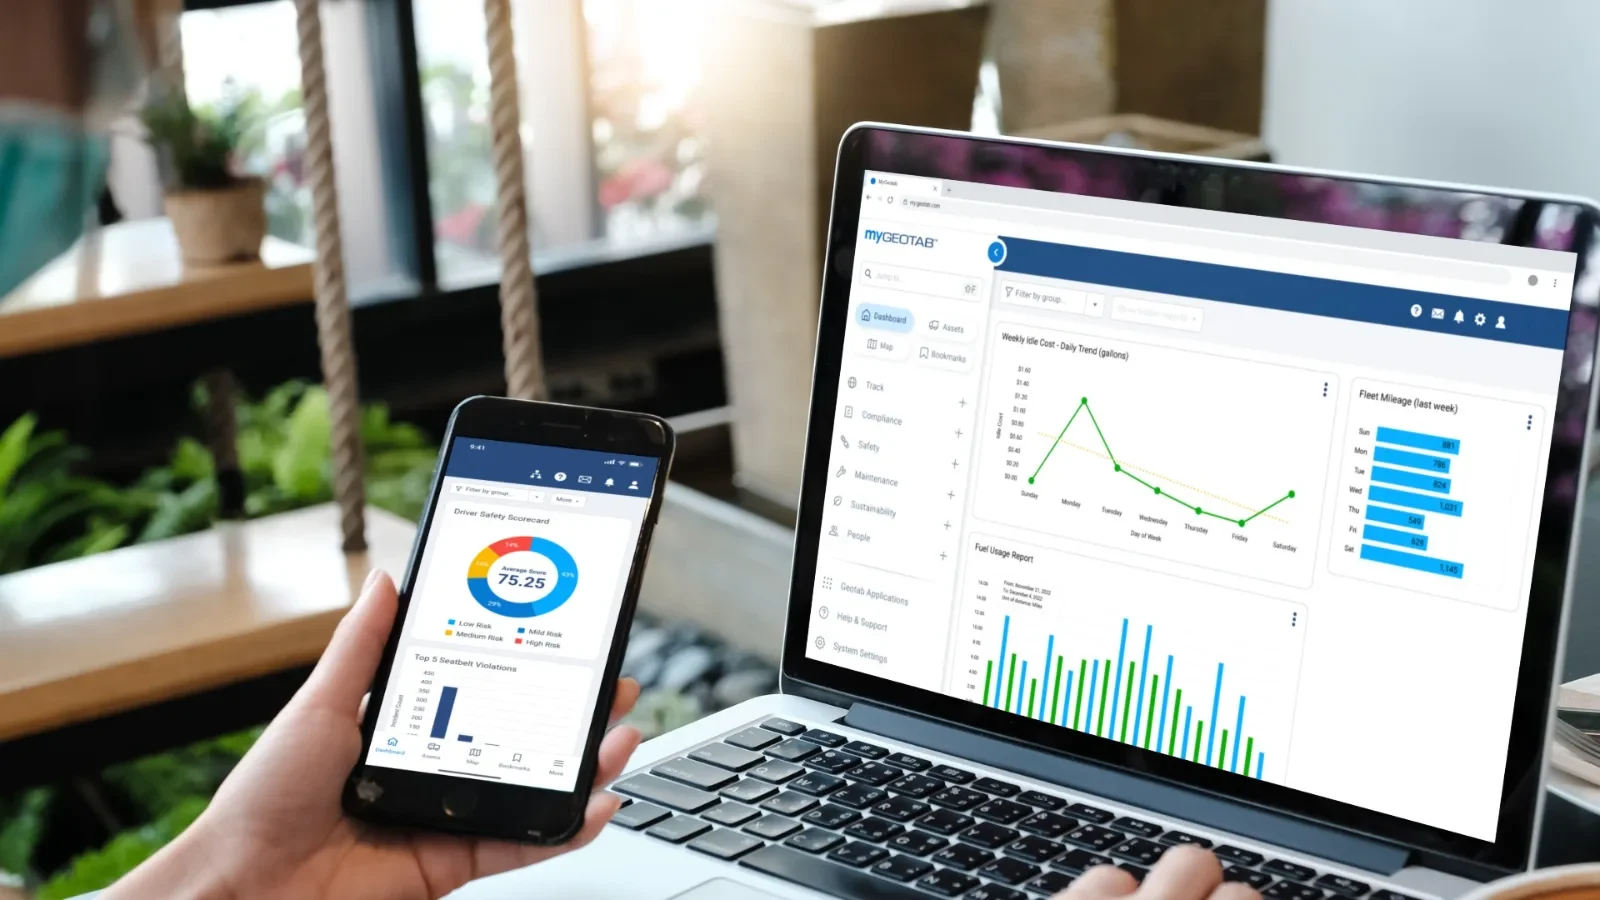
A fuel program works when the number lands where people already look. These are the MyGeotab screens behind every lever above:
- Idling Report: idle time ranked by vehicle, driver and location, with the fuel cost attached to each.
- Trips Summary: miles, stops, drive time and idling by vehicle.
- Miles versus fuel: every trip plotted, so the outliers stand out.
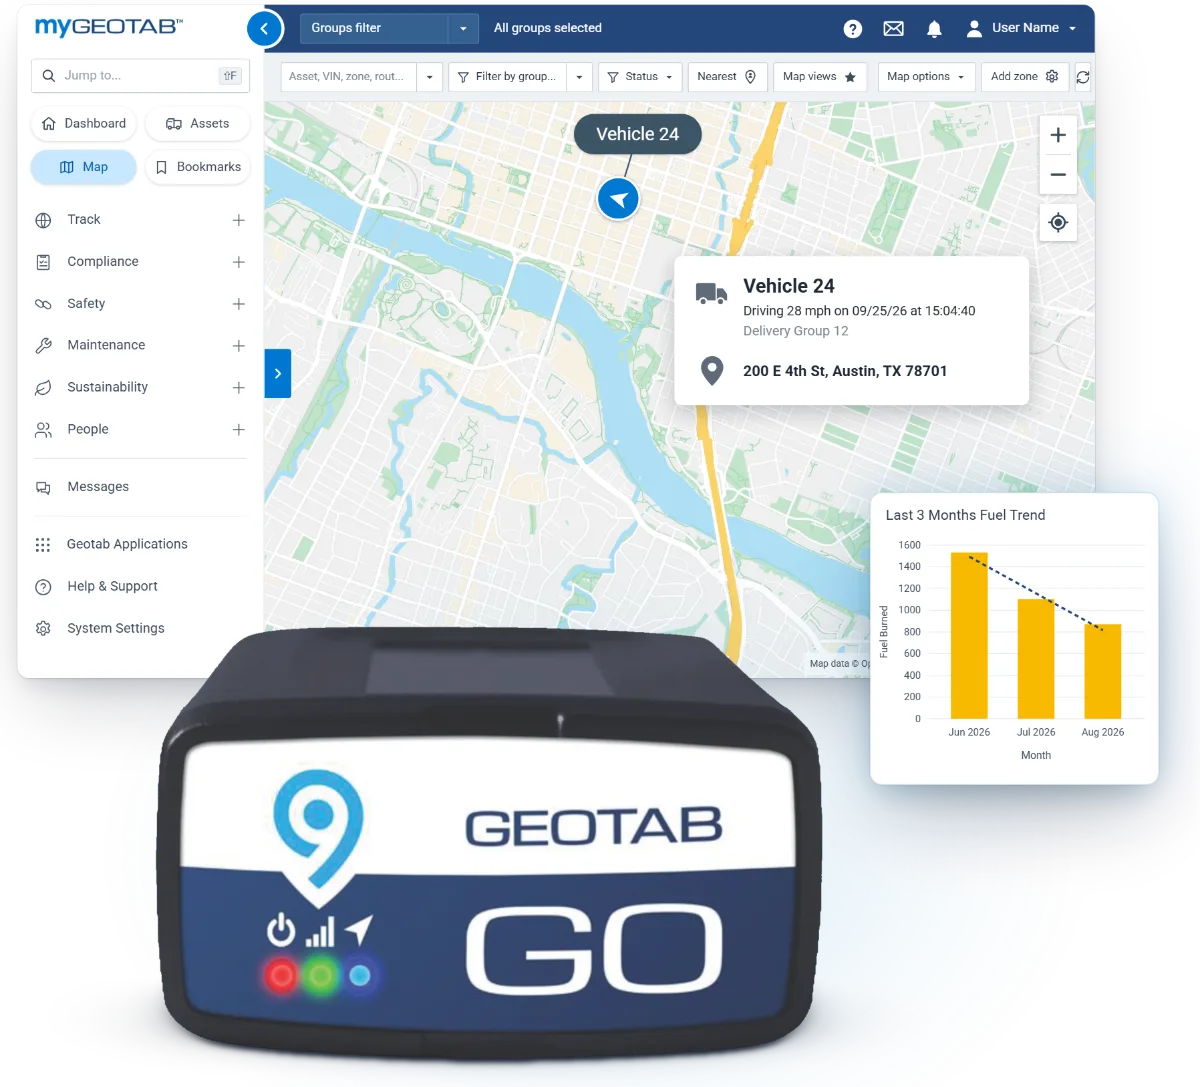
- Fuel trend and idling trend: fuel burn and idle time, month by month, so the trend since coaching started is plain to see.
- Fuel Transactions: every fuel-card purchase matched to its vehicle, with mismatches flagged.
- Active Insights: the biggest recoverable costs surface first, with the fix attached.
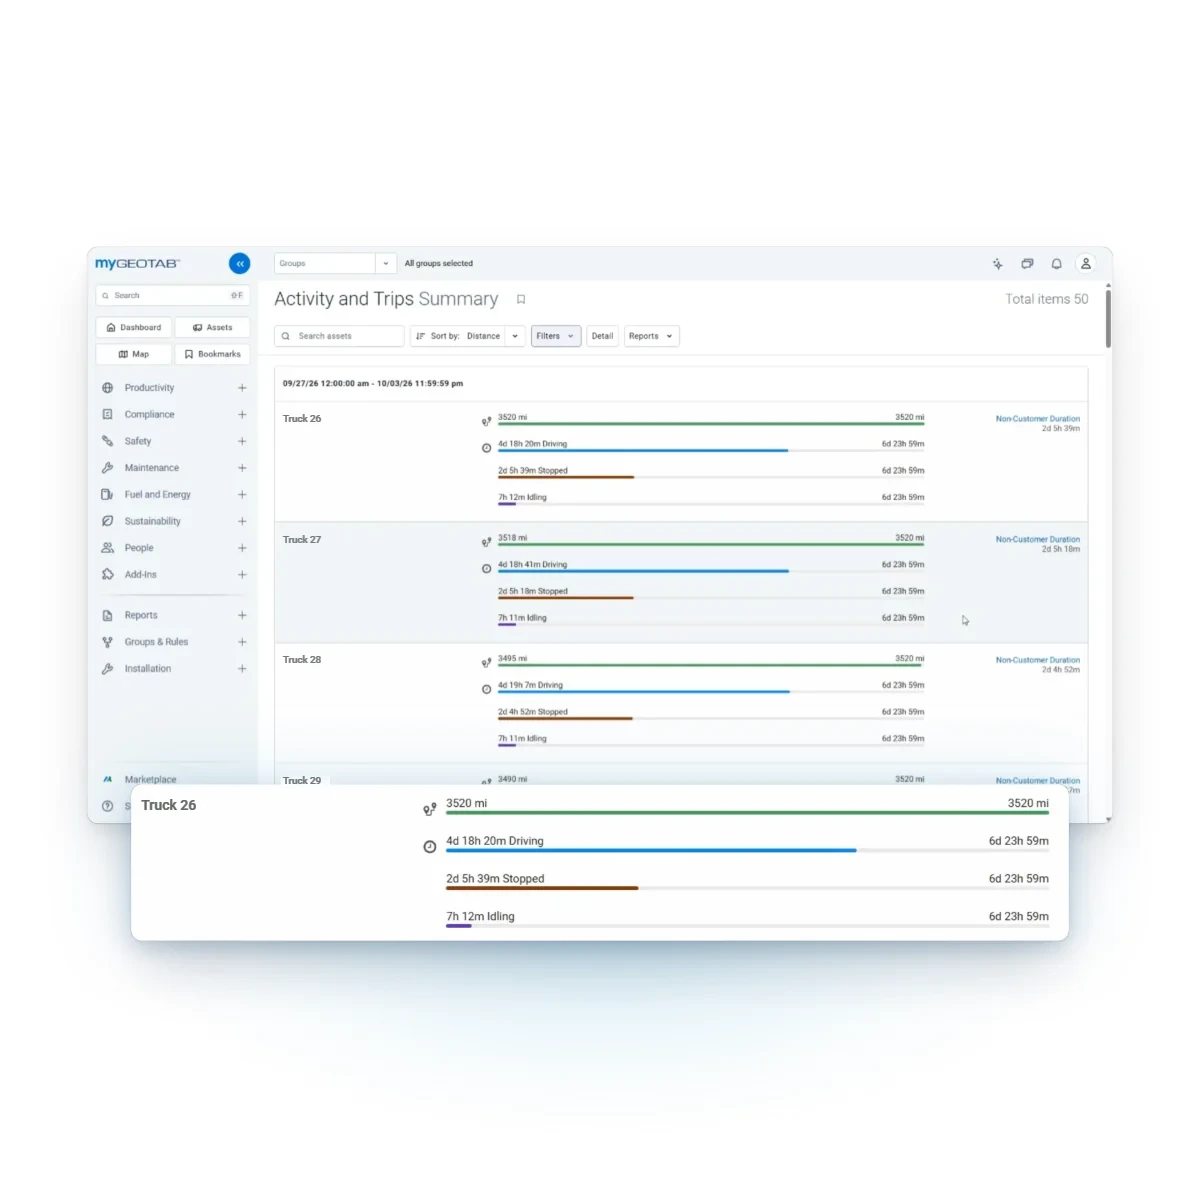
Geotab Scheduled Reports email those numbers daily, weekly or monthly, filtered so each manager sees only their own group. The weekly idling report arrives worst first, so the drivers who idle most get coached this week, not this quarter.
For a question no report answers, ask Geotab Ace in plain language: “Show me fuel efficiency trends for my region over the last quarter.” Ace returns the trend by month, with the math behind it if finance asks.
Mixed Fleet Fuel Management Across Every Site
Few fleets burn fuel in one kind of vehicle at one address. Pickups, vans and service trucks run on Geotab GO9 or Next-Gen GO10 trackers. Excavators, loaders and dozers run on the sealed GO Rugged, and idle burn, fuel and hours from every GO Rugged machine land in the same reports as your trucks. See how it works on our heavy equipment GPS tracking page.
On a job site, idle time is ranked by machine and by site, so idling rules start where the fuel actually burns.

Across several yards, the preventable split makes sites comparable, because the PTO time a bucket truck or a packer needs for the job stays out of the coaching number. Each regional manager gets idling reports filtered to their own group, leadership gets the roll-up across every site in the same format every week, and idle limits are set yard by yard. Put the yards side by side and the priorities show themselves: the yard with the most idling gets the first coaching push. Public agencies get the same setup, with public works, public safety and transit each holding their own view on one agency account.
Build Your Fleet Fuel Savings Case
A fuel case that a CFO, a board or a council signs rests on your own numbers. Here is the order that works:
Pull current fuel spend by site or department, so every later number lands against a baseline.
Normal driving gives you a true baseline. More in our post on what to expect from your free Geotab demo.
idle time with its fuel cost, miles against fuel by trip, and any after-hours movement.
Tell us the numbers leadership watches, and we schedule them to land in inboxes during your free demo.
Three habits hide the return:
- Counting every idle minute as waste. Coach the preventable share, and report it beside total idle.
- Reading fuel once a month. By the time the statement arrives, the fuel is gone. A weekly idling report puts names in front of a supervisor while the habit is fresh.
- Blending the levers into one number. Idle fuel, miles, pump checks and Fleet Card discounts are separate returns. Report each on its own line, and finance can check every one.
- EngineIdle time ranked by vehicle, driver and location
- Route15 to 30% fewer miles on Geotab Routing & Optimization, Geotab reports
- Pump42¢ a gallon in diesel savings at 4,200+ truck stops (late-2025 average)
Start With a Free Demo Device and Your Own Fuel Numbers
The results above belong to other fleets. Your own number is the one that matters, and a free demo device on your own vehicles is how you find it.
We configure your demo device before it ships, and it ships within 72 hours. Everything ships Plug-N-Play, so your own crew installs it, with no installer to schedule and zero downtime. Keep it only if the numbers convince you.
When you roll out to the full fleet, we build your groups, zones and rules before the first device ships, and we stay on the phone until every device reports. Our dedicated U.S.-based team answers in minutes, and once you sign, the Fixed Pricing Guarantee locks your price for the rest of the contract.
We have served fleets since 1999. Public agencies can buy on Sourcewell contract 102924-GEO, valid through April 2029, with cameras and asset trackers on contract (Sourcewell, 2025).
“This is without question the best investment our company has ever made!”Reliable Fire, Benson, NC
FAQ
How can a fleet reduce fuel costs?
A fleet reduces fuel costs by cutting preventable idling, driving fewer miles and checking every purchase at the pump. Geotab ranks idle time by vehicle, driver and location with the fuel cost attached, and Geotab reports 15 to 30% fewer miles for fleets on Geotab Routing & Optimization. At the pump, Fuel Transactions matches each fuel-card purchase to its vehicle and flags mismatches.
How do I work out what fleet idling costs us?
Put your own fleet size, pump price and idling target into the idling calculator on our fleet fuel management and cost savings page. It counts fuel from reduced idling alone, and a free demo device then shows your real idle time in MyGeotab, ranked by vehicle, driver and location.
Does driving behavior affect fleet fuel costs?
Yes, driving style moves the fuel line. Geotab reports 2.7% better fuel efficiency at Richards Building Supply and 6.4% at King Township with driver rewards, and the Idling Report ranks idle time by vehicle, driver and location, with the fuel cost attached to each.
Can Geotab check fuel-card purchases against our vehicles?
Yes, Fuel Transactions in MyGeotab matches every fuel-card purchase to the vehicle and flags location, tank-size and fuel-type mismatches for review. Your team then reviews a short list of flagged purchases, each with the vehicle attached, instead of the whole statement.
Where do fleet fuel savings show up in MyGeotab?
Fleet fuel savings show up in the Idling Report, the Trips Summary and Fuel Transactions: idle time ranked by vehicle, driver and location with the fuel cost attached, miles, stops, drive time and idling by vehicle, and every fuel-card purchase matched to its vehicle. Geotab Scheduled Reports email them daily, weekly or monthly, so leadership sees the numbers without a login.
Does PTO work or engine warm-up count as wasted idling?
No. Preventable idling is split out from warm-ups and PTO work automatically, so the idle time you coach is the share your drivers control. You still see total idle beside it, along with the trend since coaching started.