When you can see risk coming

The Geotab Safety Center focuses coaching where it matters most, reducing risk before incidents happen.

Inside the Safety Center
Every driver scored, every trend tracked, and the riskiest behaviors surfaced first, so coaching time lands where it actually moves the number.
+6 ptsimproved this quarter
Illustrative Safety Center view. During your free demo it runs on your own drivers and trips.
Collision Risk
Collision Risk predicts who is most likely to crash next, even drivers with clean scorecards: Geotab reports it is 20% more effective at surfacing risk than a traditional scorecard (Geotab, 2026).
The model weighs behavior, environment, and road context, so risky routes surface even with a clean record.
No rules to build. New Safety Events auto-calibrate to each asset type, so a loaded F-550 and a Camry are judged by different physics. Fewer false positives, coaching from day one.
How It Works
Safety stops being guesswork when risk is measured, ranked, and trended for you.
Rank risk across the fleet so you coach the right people first.
Spot risk trends early, before they become incidents.
Give supervisors clear talking points and accountability.
Review any event with the full picture around it.
The Coaching Loop
The behavior, the trip, the location, and (with a GO Focus camera) the clip, together on one screen.
Instead of 14 separate harsh-braking pings, the supervisor sees one pattern worth one conversation, with AI-generated Pro-Tips as talking points.
Once in the cab, through real-time audio alerts that let most drivers self-correct on the spot. Once in the Drive app, as a push notification they can review themselves.
Coaching history tracks every event and note, active versus closed, so you can prove the program ran when a carrier or a court asks.
Driver-to-trip association is automatic, even when a driver forgets to key in.
What Changes
A closer look
Built into MyGeotab, no extra software. These are the tools your safety manager opens every morning.
Drivers ordered by predicted risk, riskiest first, including clean-scorecard drivers a historical tally would miss.
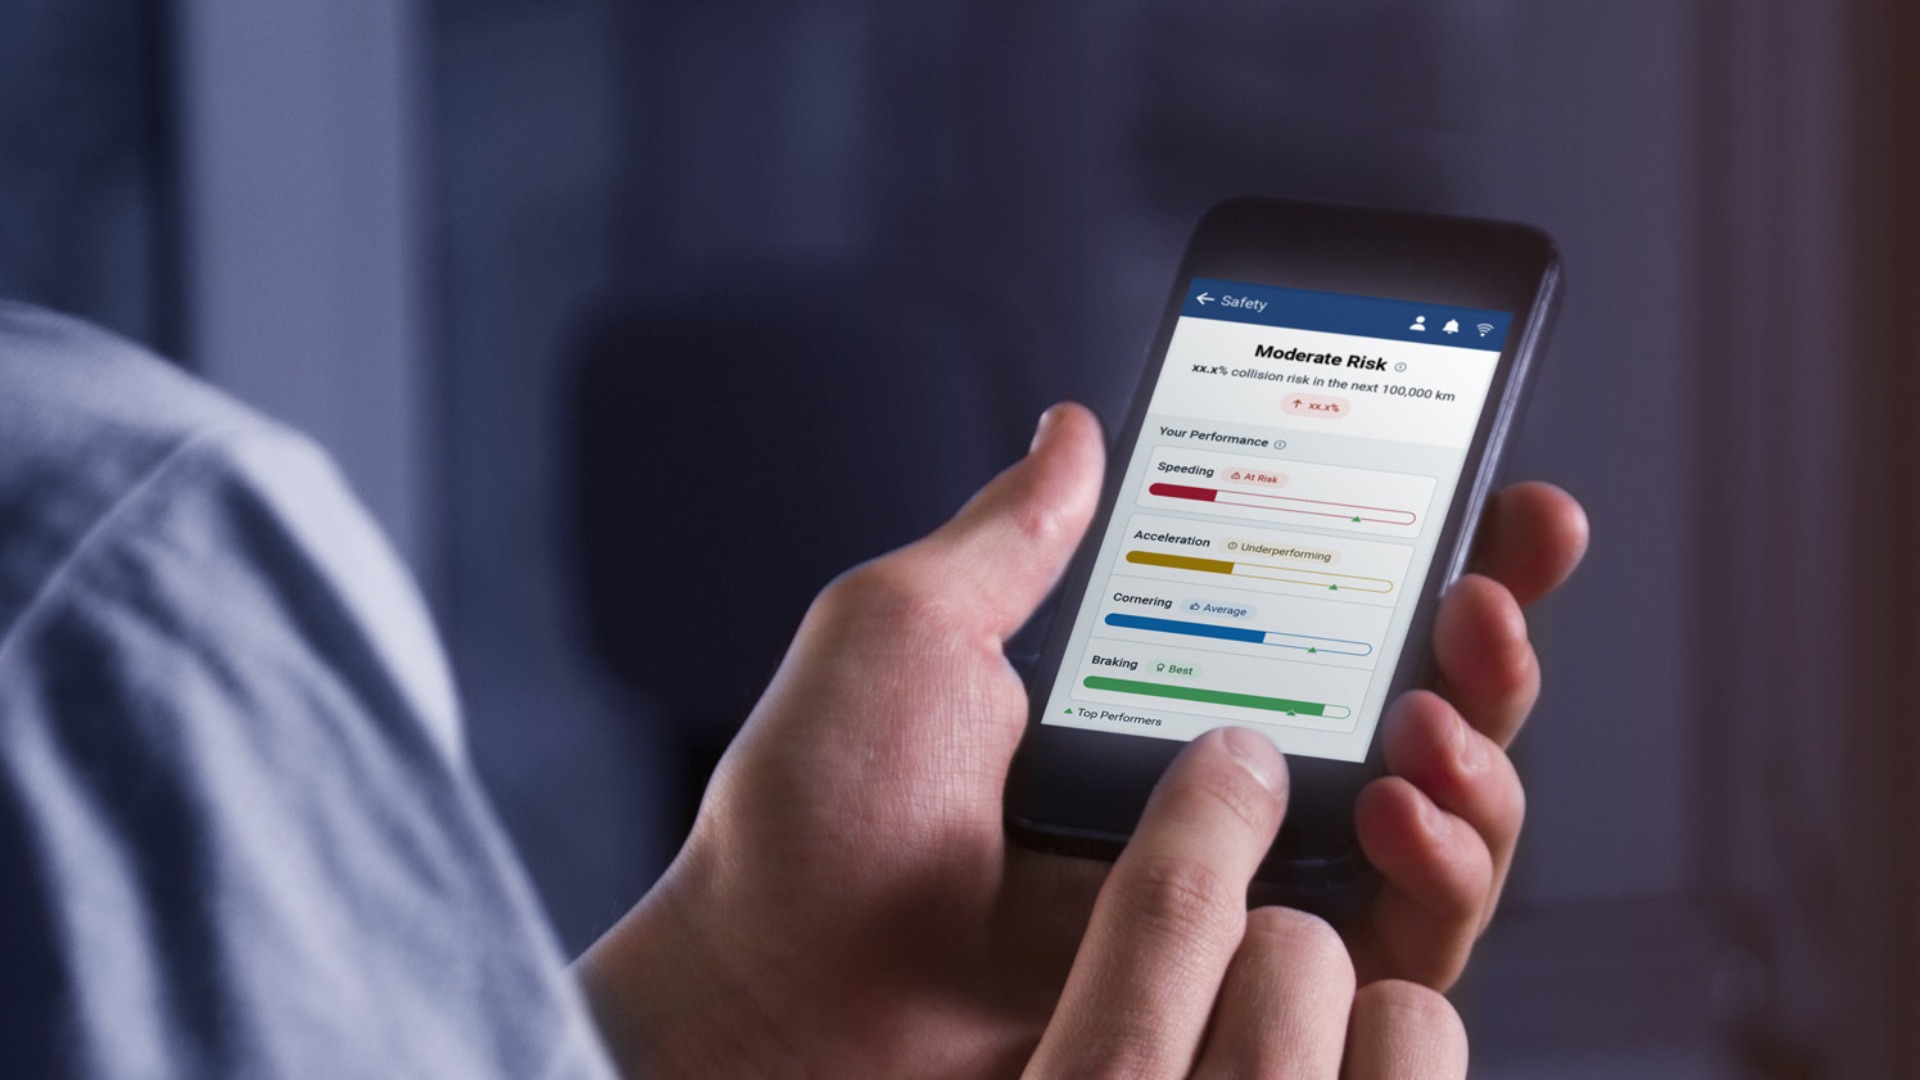
Speeding, braking, acceleration, and cornering weighted into one clear picture.
Jump from a score straight to the GO Focus dash-cam clip behind it.
Watch incident-free days climb and see which drivers have earned recognition.
Every driver sees their own score in the Geotab Drive app, so accountability is shared, not top-down.
Export any trend in one click, formatted and ready to share, with no rebuild.
Questions
It identifies high-risk drivers automatically, tracks risk trends, and benchmarks your fleet so you coach where it matters most.
It works with GO device data and integrates AI camera events from the GO Focus family for fuller context.
Geotab combines driving-behavior signals into a collision-risk view. The in-product explanation shows how each score is derived.
Your scorecard counts what a driver already did; Collision Risk flags who is most likely to crash next, including drivers whose scorecards look clean. The Collision Risk section above explains how much more effectively it surfaces that risk.
No. Collision Risk and the Safety Center run on GO device data alone. Cameras from the GO Focus family add video context and exoneration footage, and they make coaching conversations shorter, but they are an addition, not a requirement.
No. New Safety Events arrive auto-calibrated to each asset type, so there is nothing to define on day one, though you can still layer on custom rules whenever your operation needs them.
Because roughly 95% of crashes trace back to human behavior (naturalistic driving research cited in Geotab Safety 201, 2026). Fix the behavior early and you have prevented the crash, the claim, and the premium hike all at once.
Keep exploring
Inside MyGeotab
The overview shows which rules fire most, on how many assets, for how long.
Illustrative MyGeotab screen with fictional data
We will set up the Safety Center on your own data during a free demo and walk through what it finds.