When safer driving pays twice

Safety data that pays you back

A measurable safety program changes the conversation with your carrier: better scores, fewer claims.

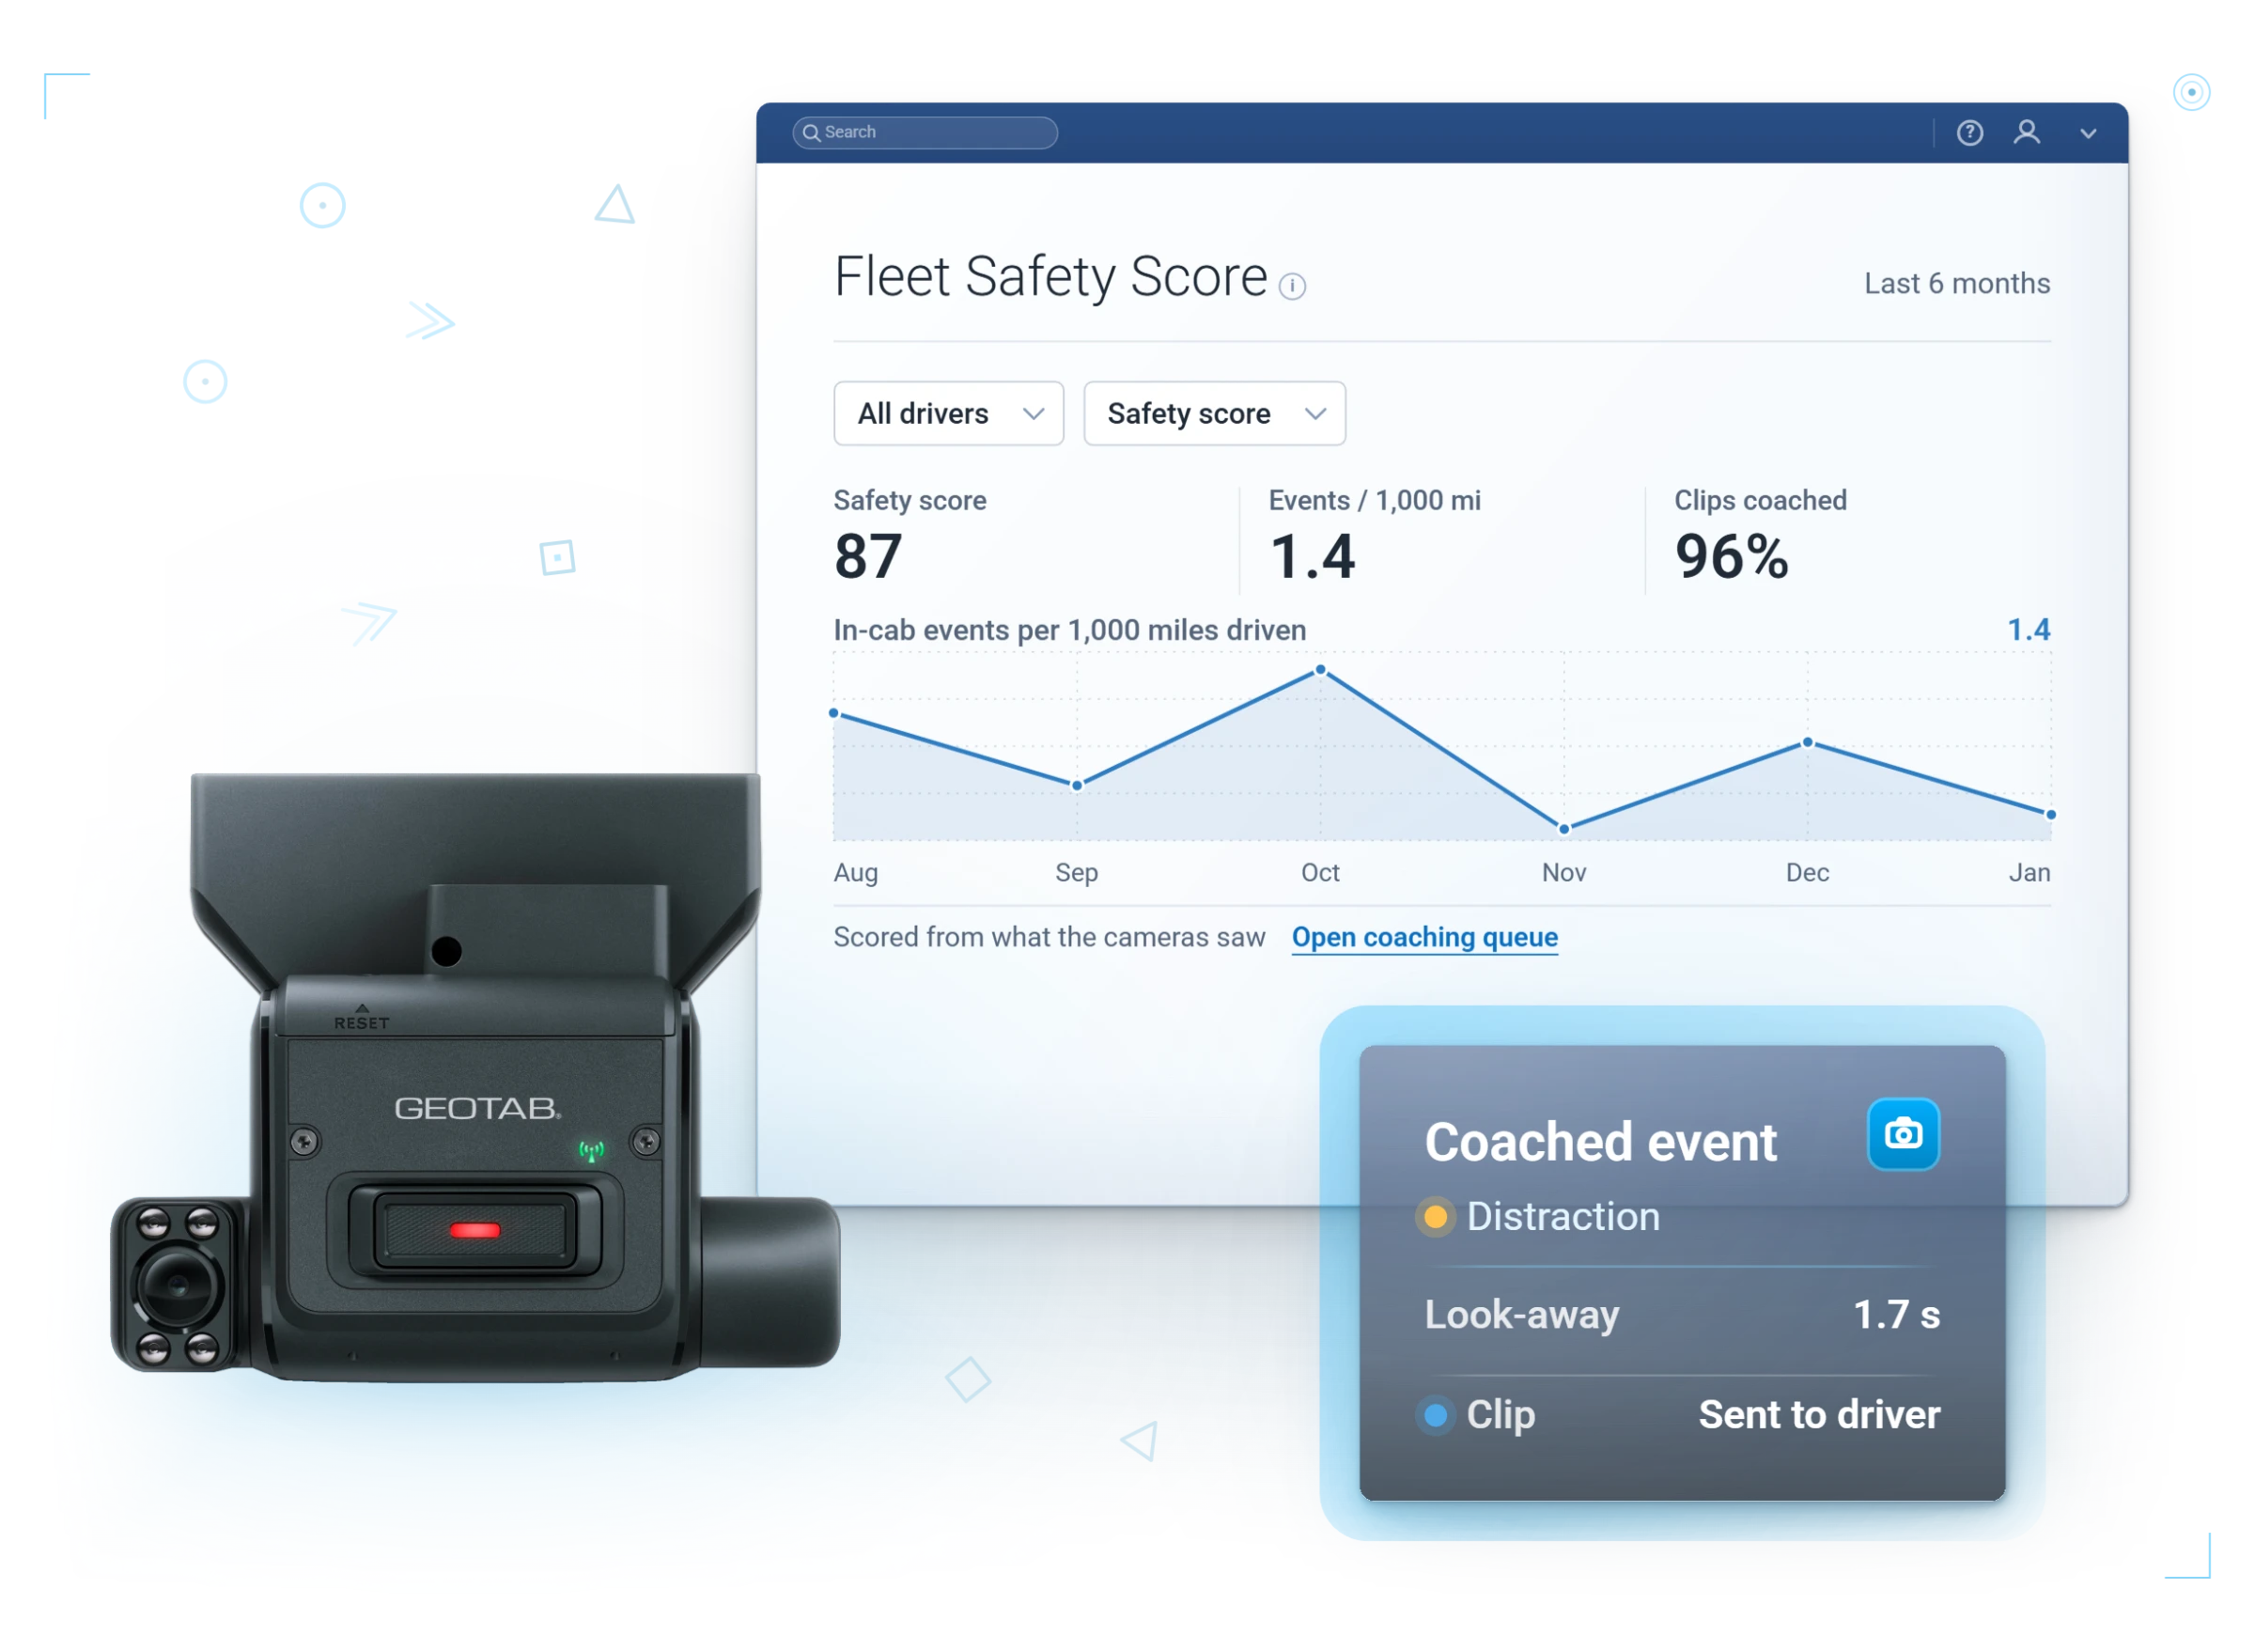
  • Improve fleet safety scores with coaching
  • Reduce claims with fewer, less severe incidents
  • Video evidence protects drivers when it was not their fault
Geotab GO Focus AI dash camera
+$0.088Per-mile rise in premiums, the steepest climb in a decade, roughly 5% of operating costs (ATRI, 2023)
$1.12Paid in claims by auto insurers for every $1.00 collected in premiums (Insurance Information Institute, 2023)
12.5%Rise in commercial insurance costs in 2024 alone (RPS Transportation Market Outlook)

Carriers are not raising your rate because of your fleet. They are raising it because they cannot tell your fleet apart from everyone else's. Data fixes that.

Risk, Managed

Walk into renewal with proof

Carriers respond to documented, trending safety data. Give them a reason to.

Trackable safety program

Scores, coaching records, and trends that document improvement.

Video exoneration

Road-facing footage clears drivers and shuts down false claims.

Falling incident rates

Fewer harsh events and collisions, quarter over quarter.

Renewal-ready reporting

Hand your broker the story in numbers.

Coaching session reviewing a driver safety score

What Changes

What your fleet gets out of it

Fewer claims filed

Prevented incidents are the cheapest kind.

See it in MyGeotab
Real MyGeotab widget: collision risk trend
Claims close faster

Video and trip data end disputes quickly.

See it in MyGeotab
Real MyGeotab widget: vehicle events
Stronger negotiating position

Documented risk reduction supports better terms.

See it in MyGeotab
Real MyGeotab widget: safety benchmarking

Usage-Based Insurance

Share the data. Get judged on how you actually drive.

Usage-based insurance (UBI) programs price your fleet on measured behavior instead of industry averages.

Through Geotab Data Sharing you send a defined slice of telematics data, such as GPS, speed, trips, odometer, and VIN, to a participating insurer. You approve exactly which data types and which recipient, and you can end the connection at any time.

We make sure your data is clean, your safety program documented, and the connection live before you ask.

What insurers have promoted for connected fleets

  • At least 5% and up to 12% with Progressive Commercial's Smart Haul
  • Up to 20% with HDVI
  • Up to 30% for safe drivers with Cover Whale

(Insurer programs, 2023, subject to change.) Your carrier sets the terms, not GPSFMS and not Geotab.

The video effect: fewer injury crashes, faster exonerations. Event video plus coaching is linked to 35% fewer injury crashes (J.J. Keller, 2023). And when the crash was not your driver's fault, footage plus reconstruction data ends the fault argument early. The clip that clears your driver may be the most valuable file your fleet produces.

A closer look

Evidence your carrier can work with

Talk is not evidence. These are the records that turn a safety program into something a carrier and an adjuster can actually use.

Risk scoring


Objective driver and fleet risk, tracked over time. Geotab's Predictive Collision Risk model is benchmarked on 6M+ connected vehicles and runs 20% more effective than a traditional scorecard (Geotab Safety 201, 2026).

Video evidence

Dash cam clips attach to the exact event, so the footage you need is easy to pull when a claim lands.

Collision reconstruction

Detailed vehicle data around the moment of an incident.

Coaching records

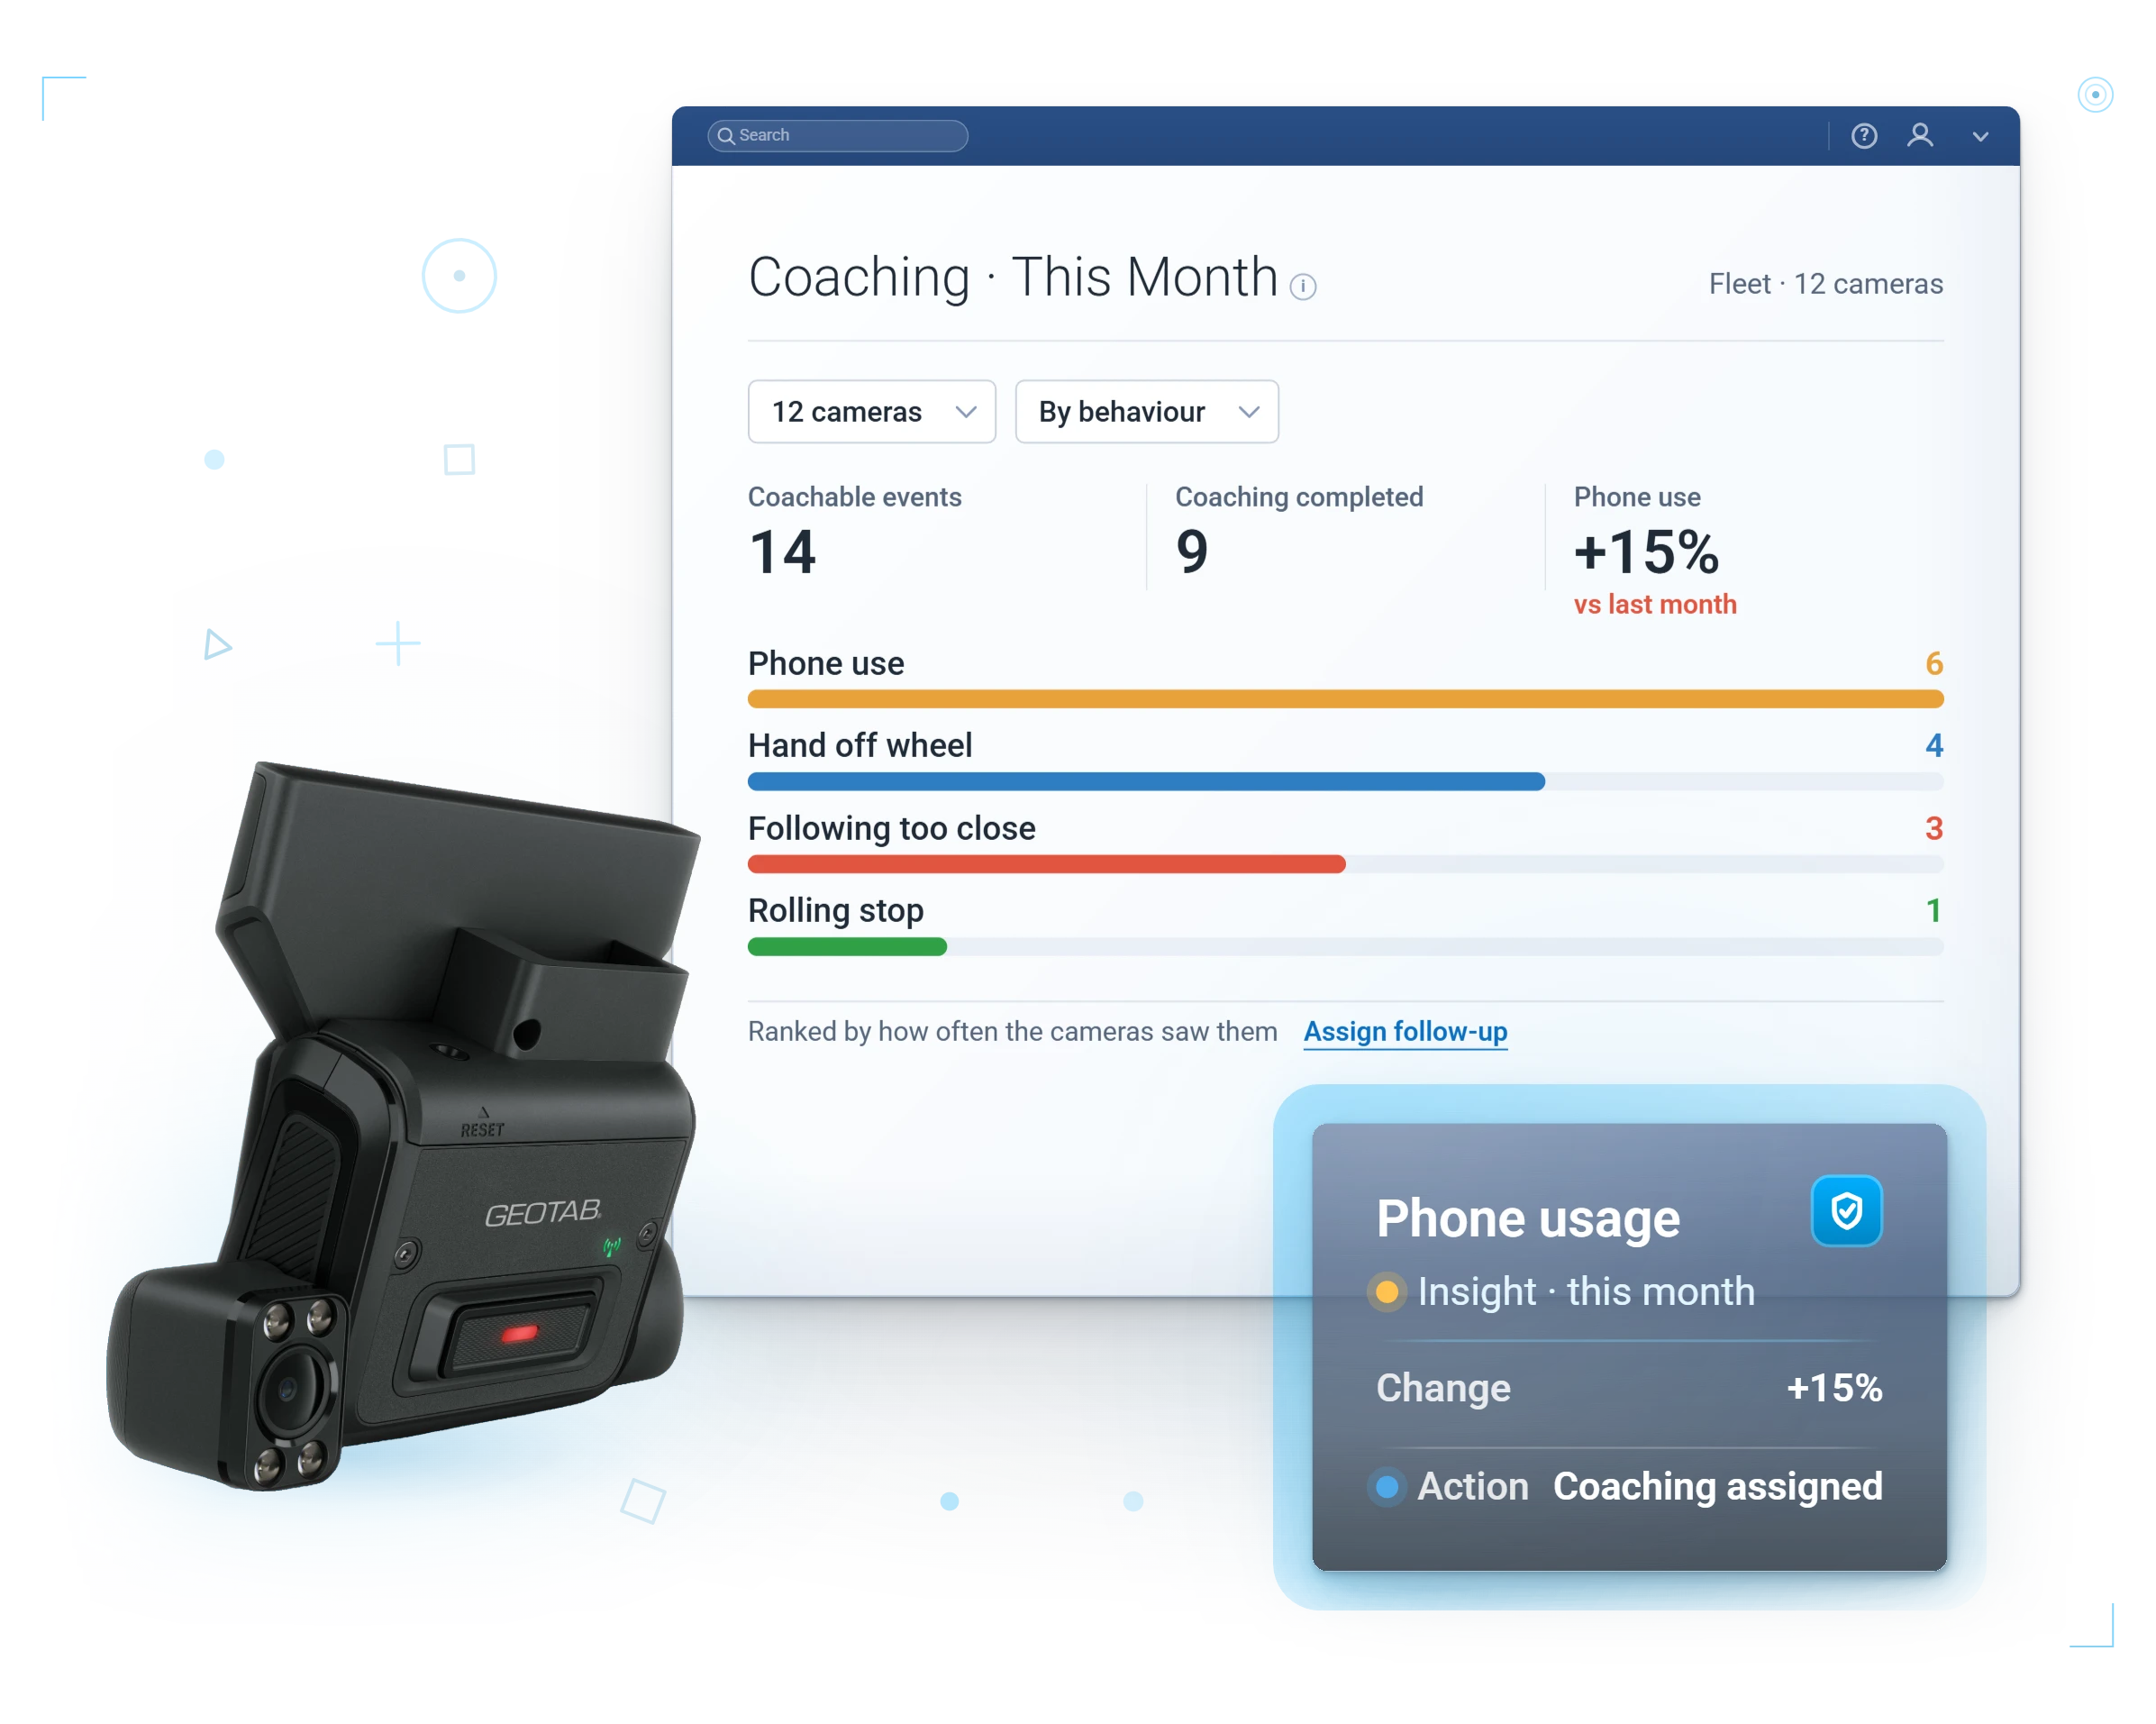
Prove risky behavior is found and corrected.

Claims-ready reports

Trends and history packaged for carriers and counsel.

Program documentation

A safety program on paper, not just in intentions.

In MyGeotab

Risk you can point to

Fleet risk distribution, ready to hand across the table.

Questions

Insurance and risk FAQ

Can telematics lower my insurance premium?

Many insurers offer usage-based or safety-based programs, and a documented safety record can support better terms at renewal.

What data helps with claims?

Trip history, speed, and footage from the GO Focus cameras provide objective evidence that can speed up and clarify claims.

How do we lower risk in the first place?

Safety scoring, in-cab alerts, and coaching workflows reduce the risky behaviors that lead to collisions before they happen.

What is usage-based insurance?

A policy priced on your measured driving data instead of a flat industry class rate, so safer measured behavior earns better terms. The data goes to the insurer through Geotab Data Sharing, described in the Usage-Based Insurance section above.

How big are the discounts really?

The published carrier programs are listed in the Usage-Based Insurance section above. Treat any specific figure as a starting point, not a promise: your carrier sets your actual number from your measured data, and nobody honest will quote it before they see how your fleet drives.

Does sharing data mean the insurer sees everything?

No. As covered in the Usage-Based Insurance section, Data Sharing is opt-in and revocable: the insurer receives only the data types you approve, nothing more.

What if we are not ready to share data with an insurer?

Then build the record first. A documented safety program, trending scores, and coaching history strengthen a conventional renewal too. Sharing is a lever you pull when it pays.

Build your case before renewal

Start a free demo now and walk into your next insurance conversation with data.

Prefer to talk? Call (877) 771-2236. No spam, ever.

We reply within one business day. No obligation, no spam. Prefer to talk? (877) 771-2236