When the data picks your first EVs
Plan EV adoption with Geotab: real range data, charging insights, and vehicle-by-vehicle suitability.

EV Adoption
Your existing telematics data already knows which routes and vehicles fit an EV.
Match daily duty cycles against real EV range and cost profiles.
See charge status and plan charging around the workday.
Know which routes finish with margin, in every season.
Document progress for boards, customers, and regulators.
What Changes
The Decision Logic
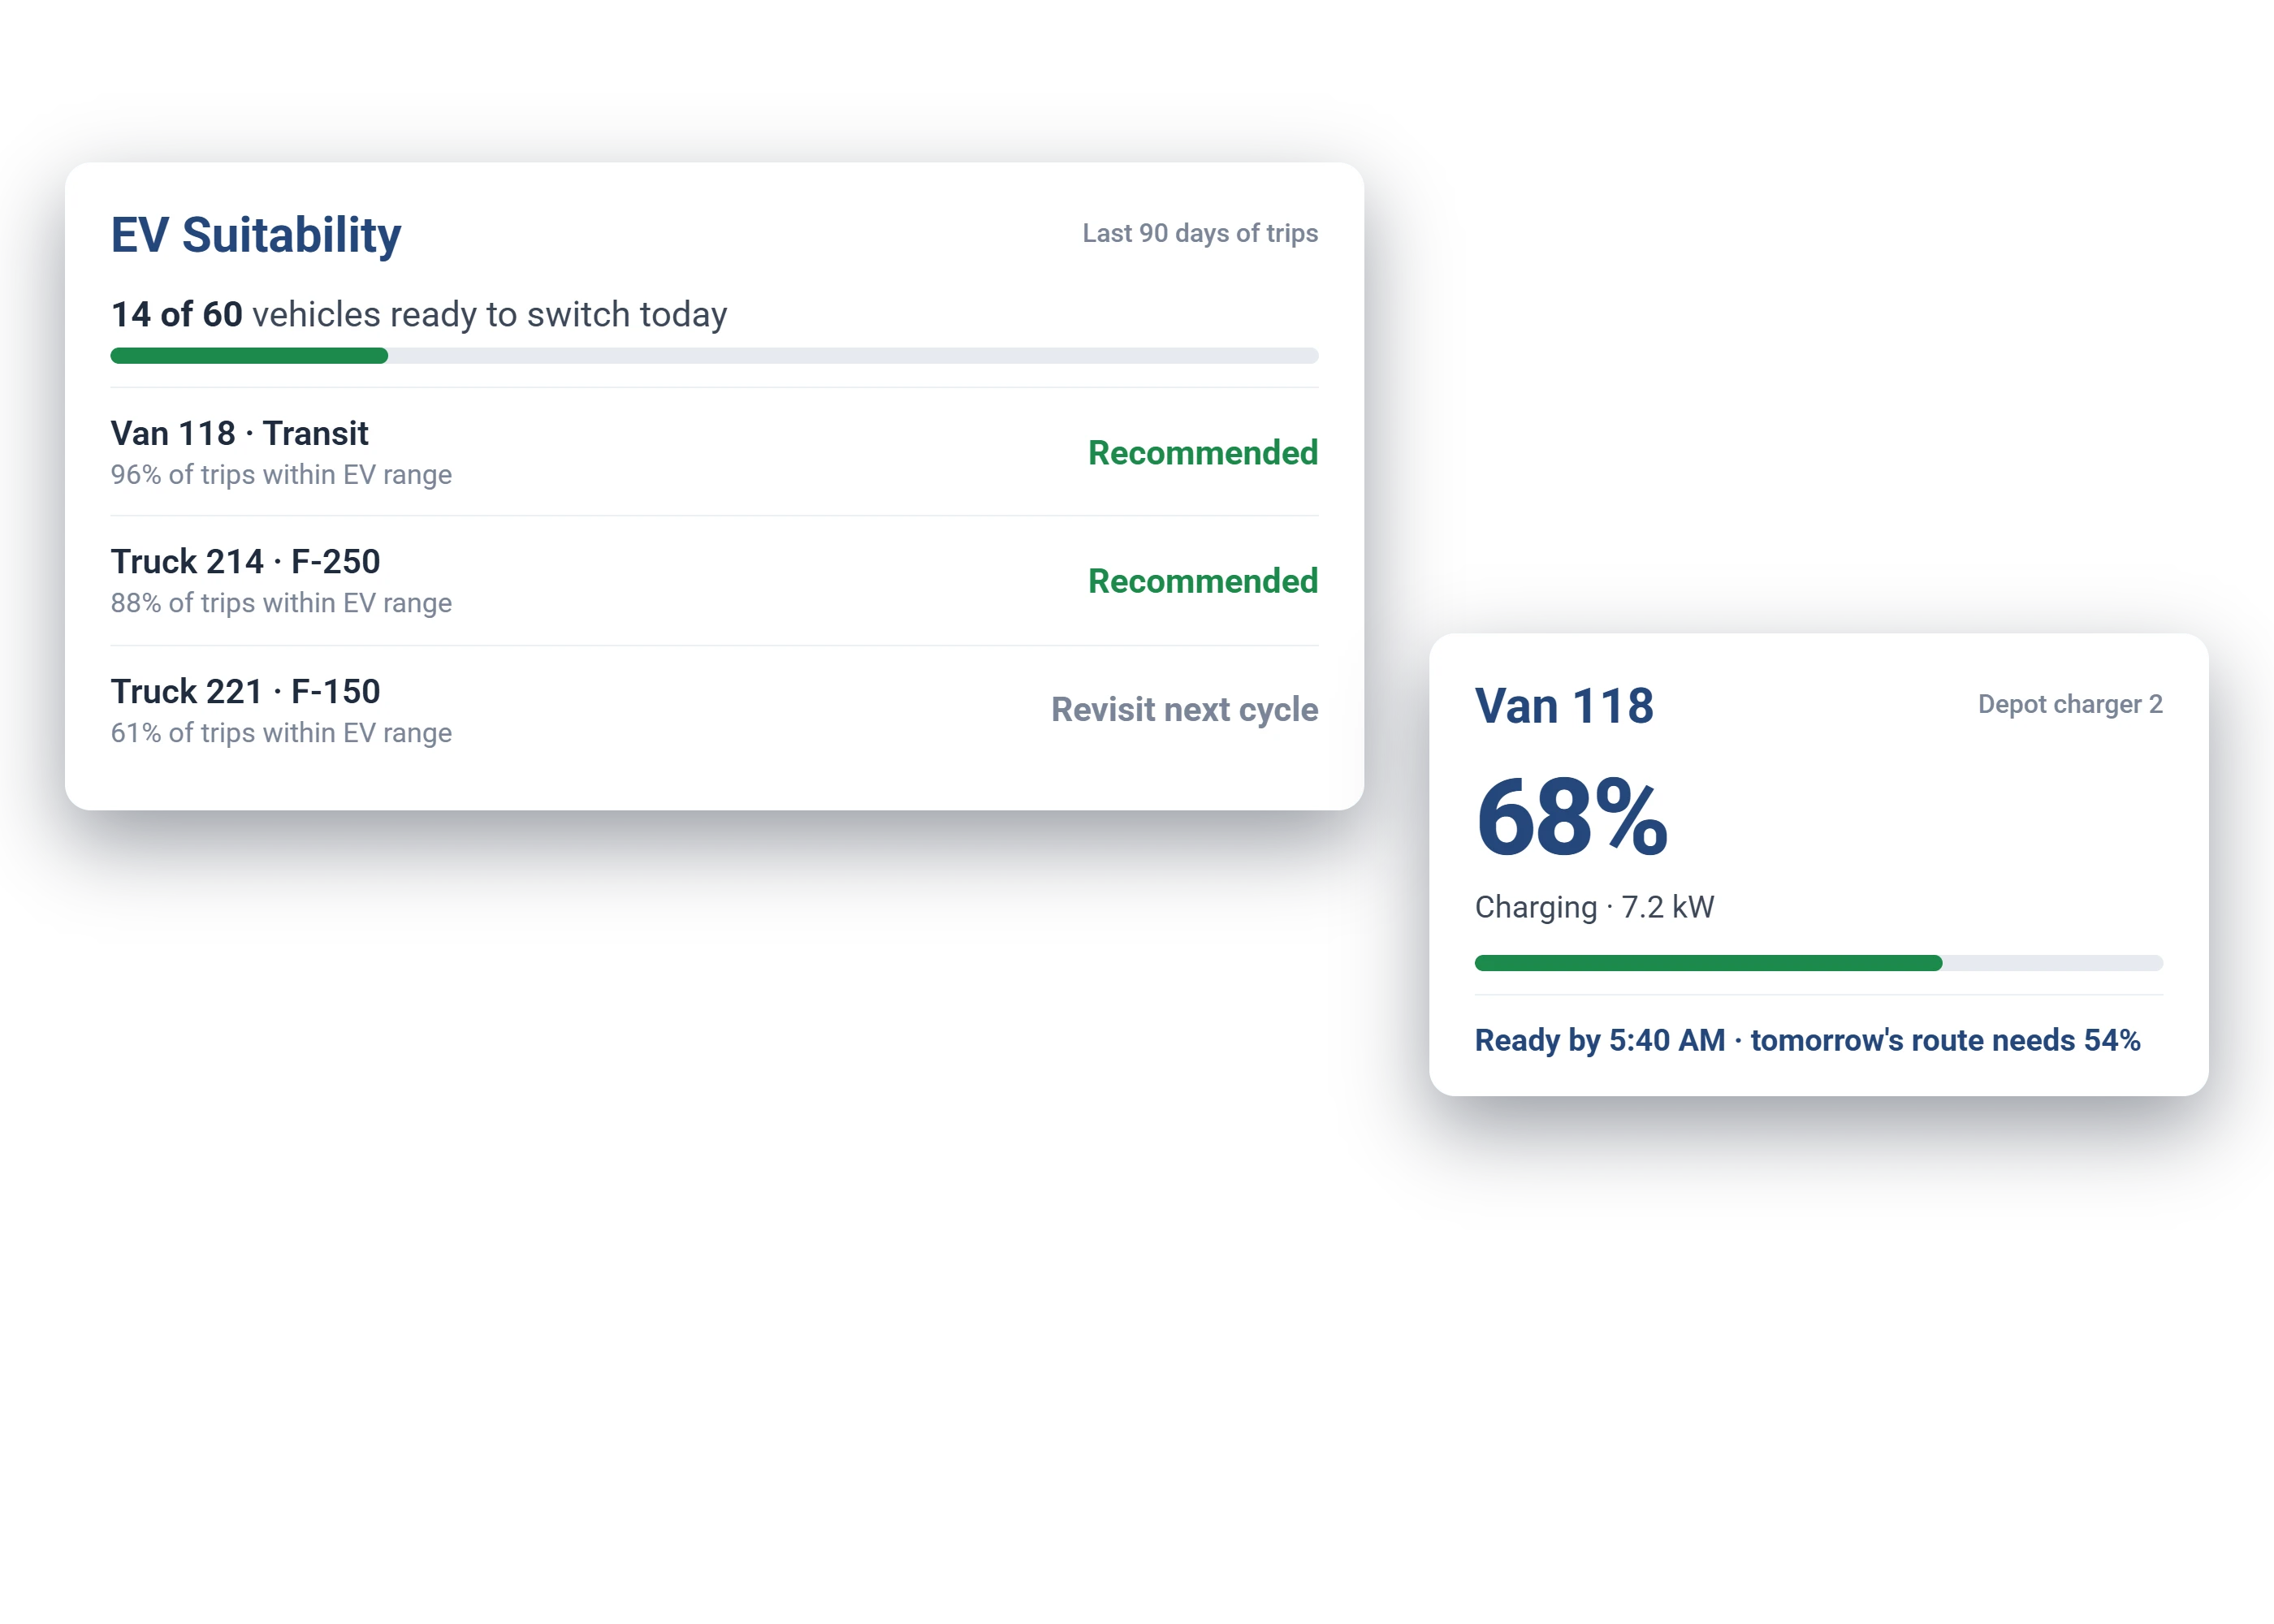
The EV Suitability Assessment runs your fleet's real telematics history (daily distances, fuel use, dwell locations, stop durations) against Geotab's per-model EV simulation data, covering 300+ EV makes and models (Geotab).

An EV can run that vehicle's actual daily cycle without mid-day charging, checked month by month against local temperature, because winter range is the number that matters.
The vehicle regularly dwells somewhere charging can be installed. The simulation models real sessions at 7.6 kW, workplace-only or workplace-plus-home (per Geotab's EVSA).
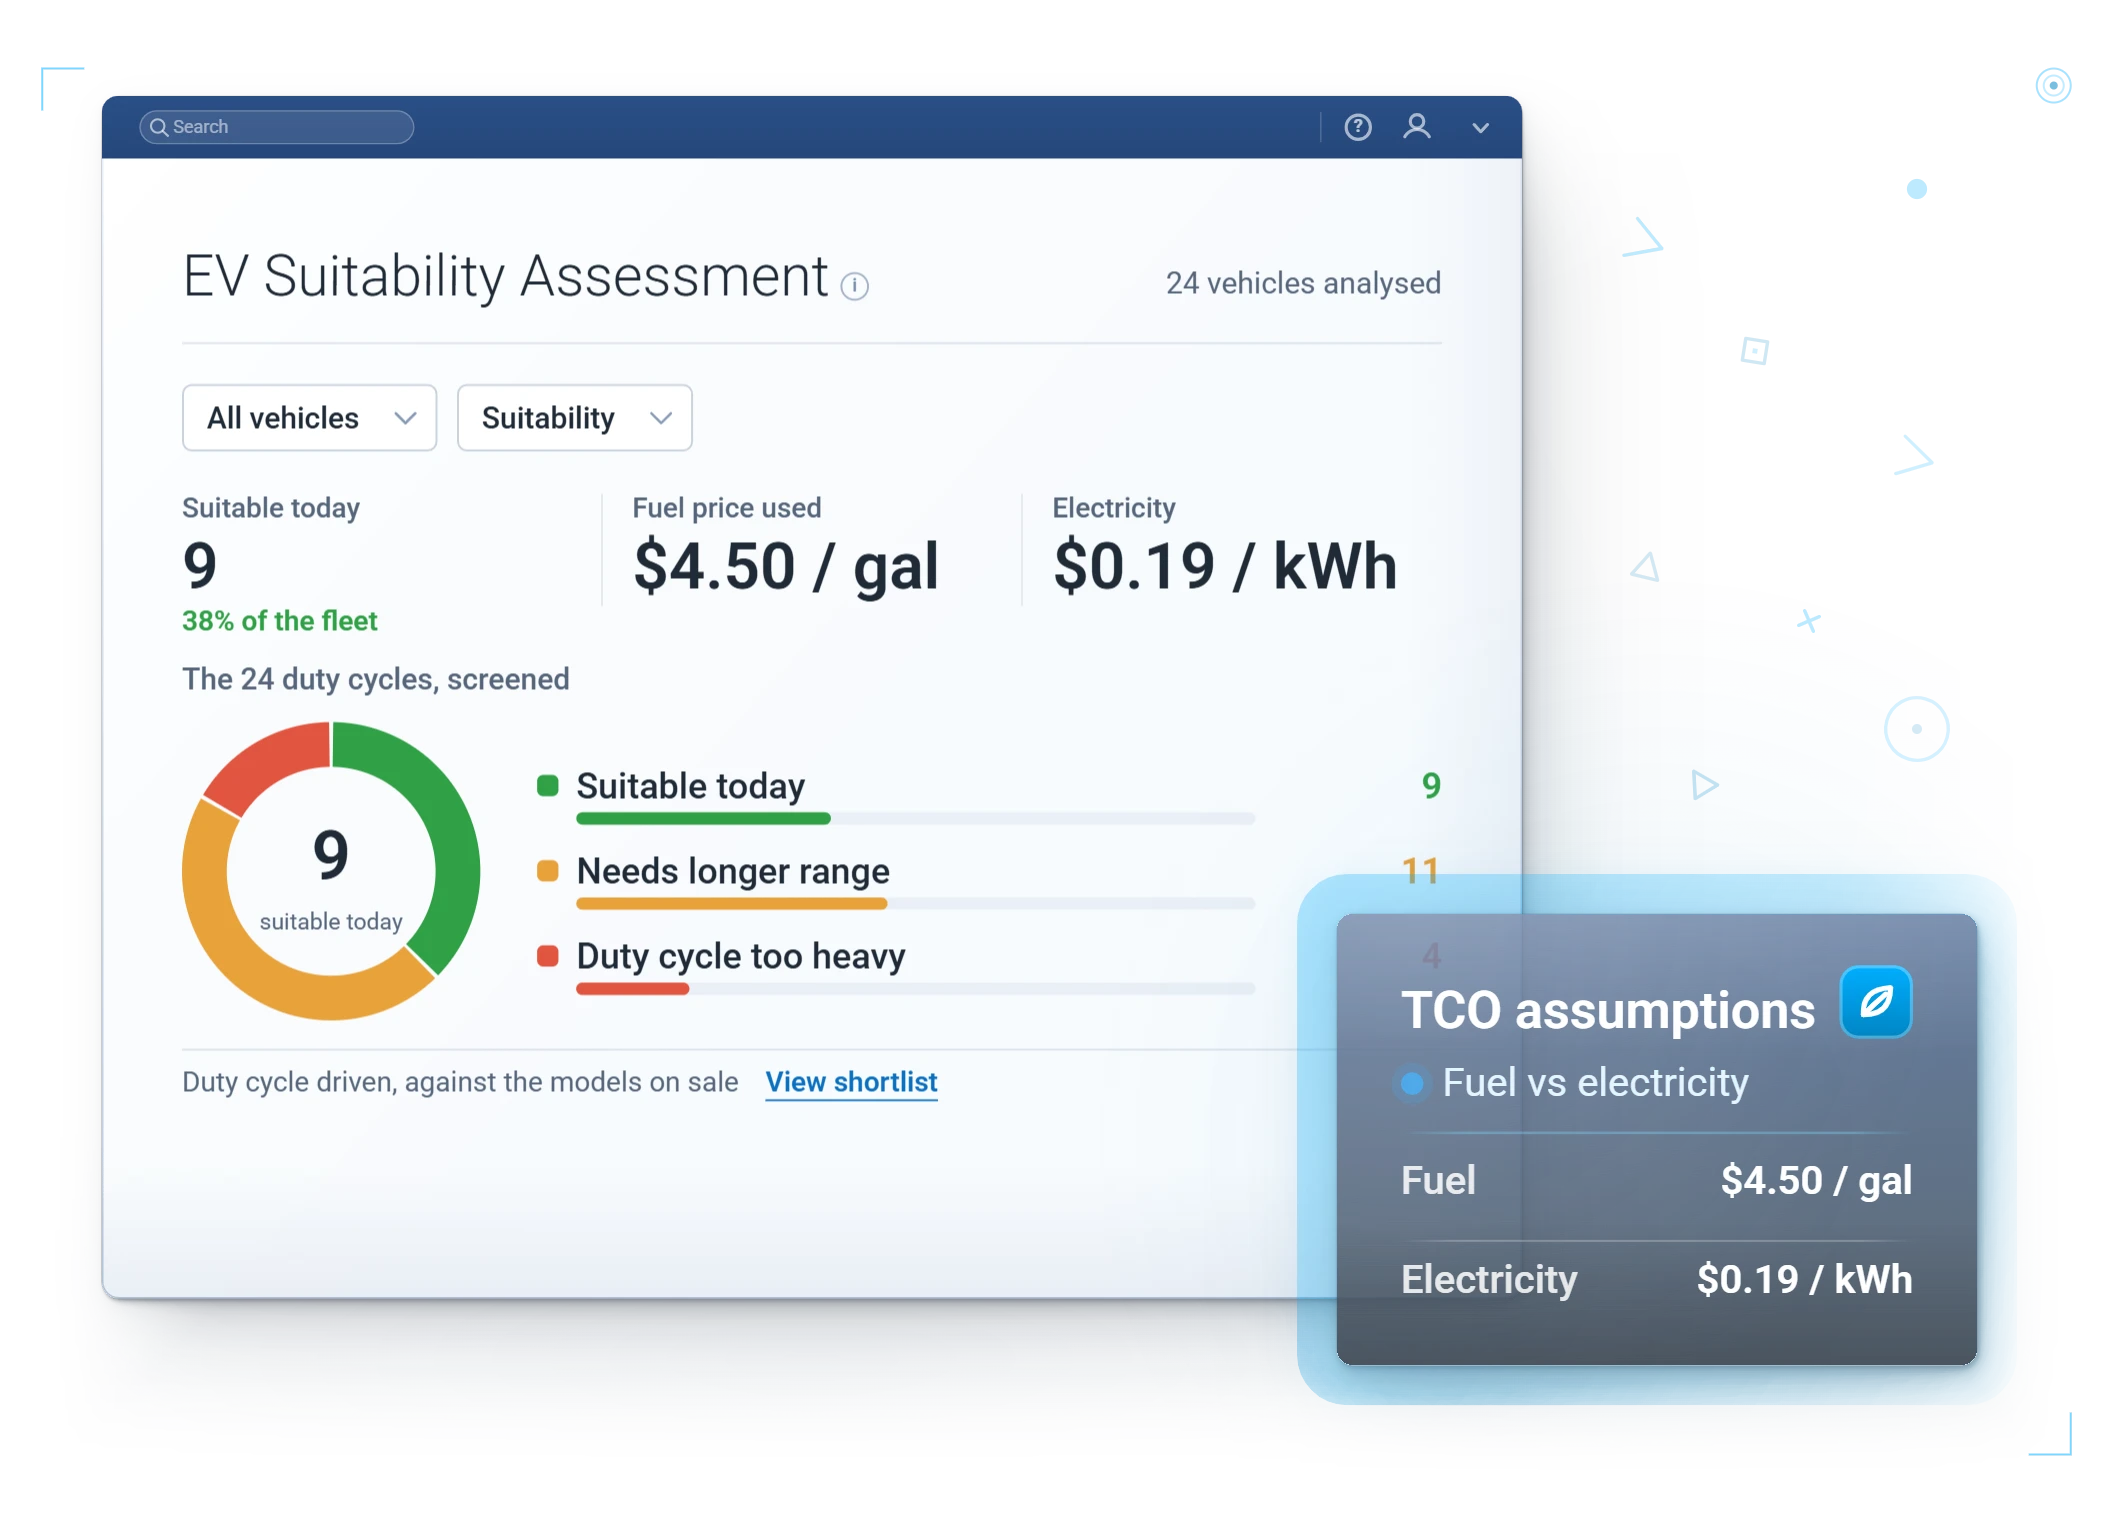
Lifetime cost (acquisition, resale, maintenance, fuel versus electricity, incentives) comes in under the equivalent gas replacement.
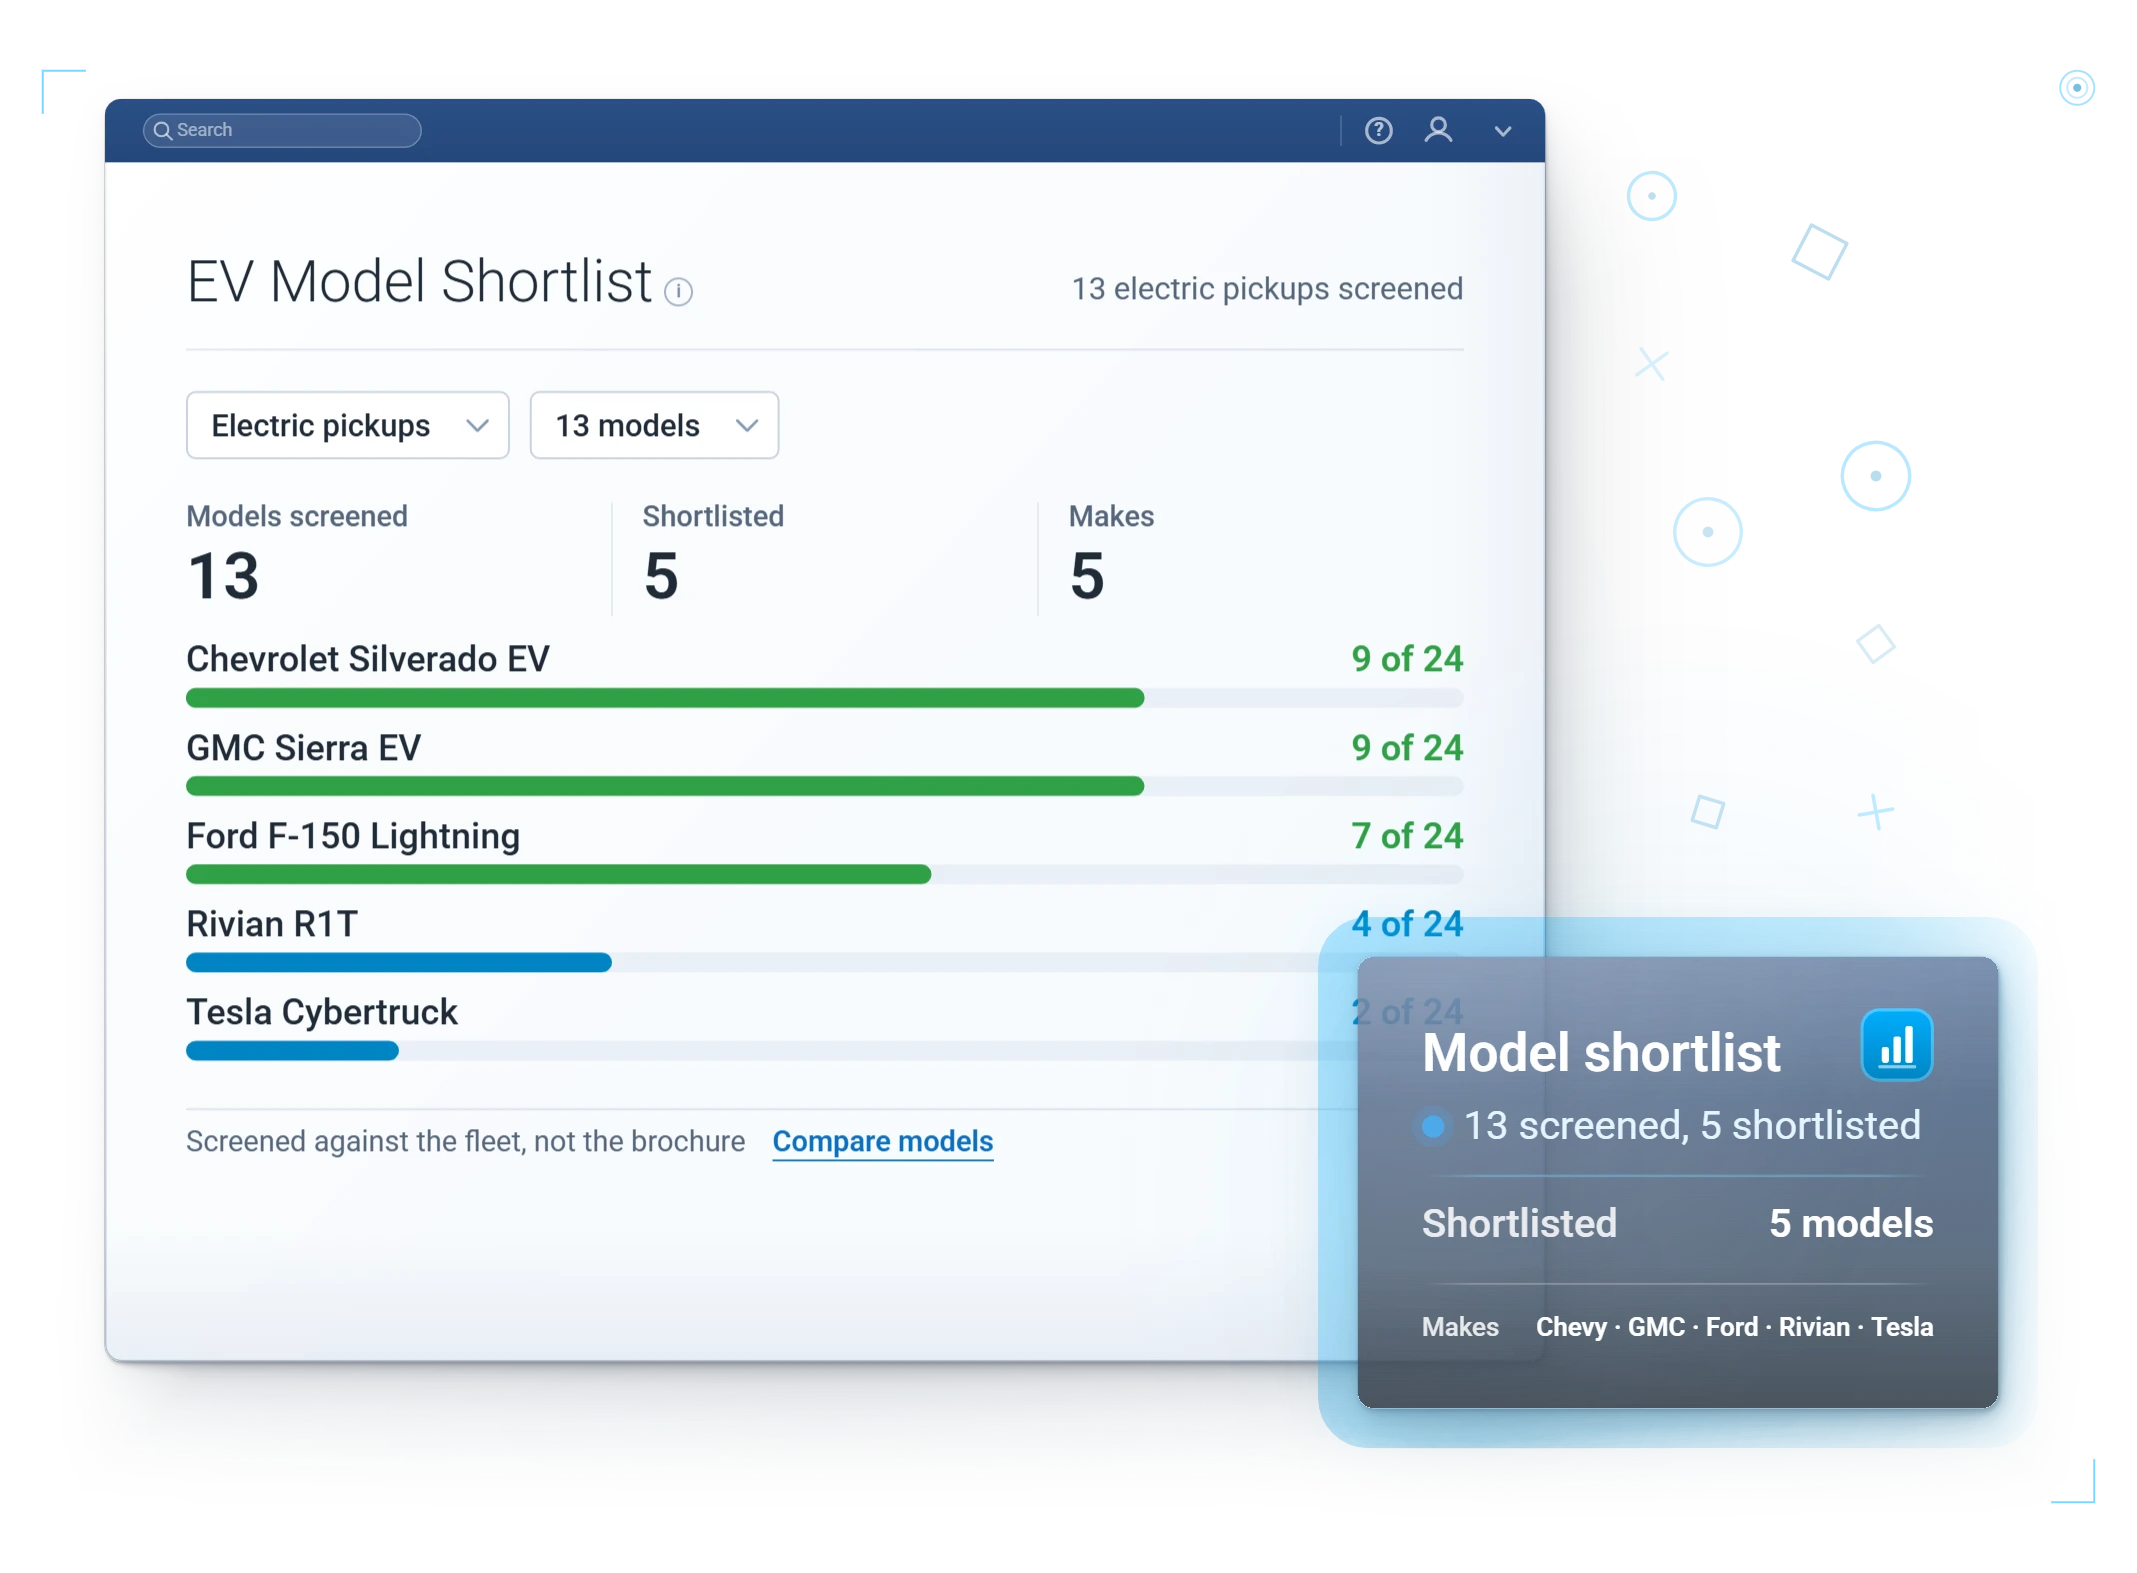
Fail any test, no recommendation. It also matches size: the tool will not swap your pickups for hatchbacks to make the math look good. Four-plus weeks of driving data per vehicle gives it enough to work with, and a full seasonal cycle is better (per Geotab's EVSA). For US fleets, the assessment runs with USD cost defaults and is not restricted to locally sold models, so treat model-level picks as directional.
After The Purchase
Once EVs are in service, the EV Performance page in MyGeotab tracks three things the window sticker never told you.
Battery State of Health, Usable Capacity, and Range: what the pack has lost, holds, and can do today. That is how you assign EVs to routes they will finish and catch degradation in warranty.
For leadership and reporting, the Sustainability Overview rolls it up: emissions intensity, tailpipe emissions, and tailpipe emissions avoided from the EVs you have already deployed, with the whole dashboard exportable to Excel.
Progress toward the goal, in a format the board and the grant application both accept.

In MyGeotab
EVSA verdicts, live charging status, and EV Performance history all read from the same GO data you already collect.
A closer look
The platform already knows how your vehicles are used. Electrification starts from that truth.
Start where the switch is provable: the assessment names the vehicles that go electric cleanly today, so a small pilot makes the case before you commit budget to the rest.
This is the number finance signs off on: total cost over the vehicle's life, not the upfront sticker price.
State of Health and real range, tracked per EV once it enters service.
Fuel & Energy
Fuel economy, fuel used, and tailpipe CO2e in one view, for the vehicles you run today and the EVs you are weighing.
The CO2e figures are not estimates pulled from the air: tailpipe emissions are calculated from measured fuel use using published factors, 8.81184 kg CO2e per gallon of gasoline (EPA) and 2.06196 kg CO2e per litre (DEFRA), while EV savings credit roughly 0.4 litres of fuel avoided per kWh (Geotab). Gas, diesel, and electric roll up on one comparable basis.
Questions
The EV Suitability Assessment analyzes your real driving patterns to show which vehicles can switch to electric without disruption.
Yes. The platform tracks range, state of charge, and charging alongside your conventional vehicles.
EV planning supports clean-fleet and CARB-related goals with data instead of guesswork.
At least four weeks of driving data per vehicle for meaningful results. Fleets with seasonal swings should include more, and range is checked against local monthly temperatures either way.
Not by design. Range, charging viability, and lifetime cost all have to pass, and size matching prevents absurd swaps. If the honest answer for a vehicle is "not yet," that is the answer you get.
Ongoing battery tracking in the EV Performance page described above, so you catch degradation while it is still a warranty conversation.
Keep exploring
Inside MyGeotab
Emissions intensity, idling waste, and EV suitability in one MyGeotab view.
Illustrative MyGeotab screen with fictional data
We will run suitability analysis on your fleet’s real data and show you where electrification pays.