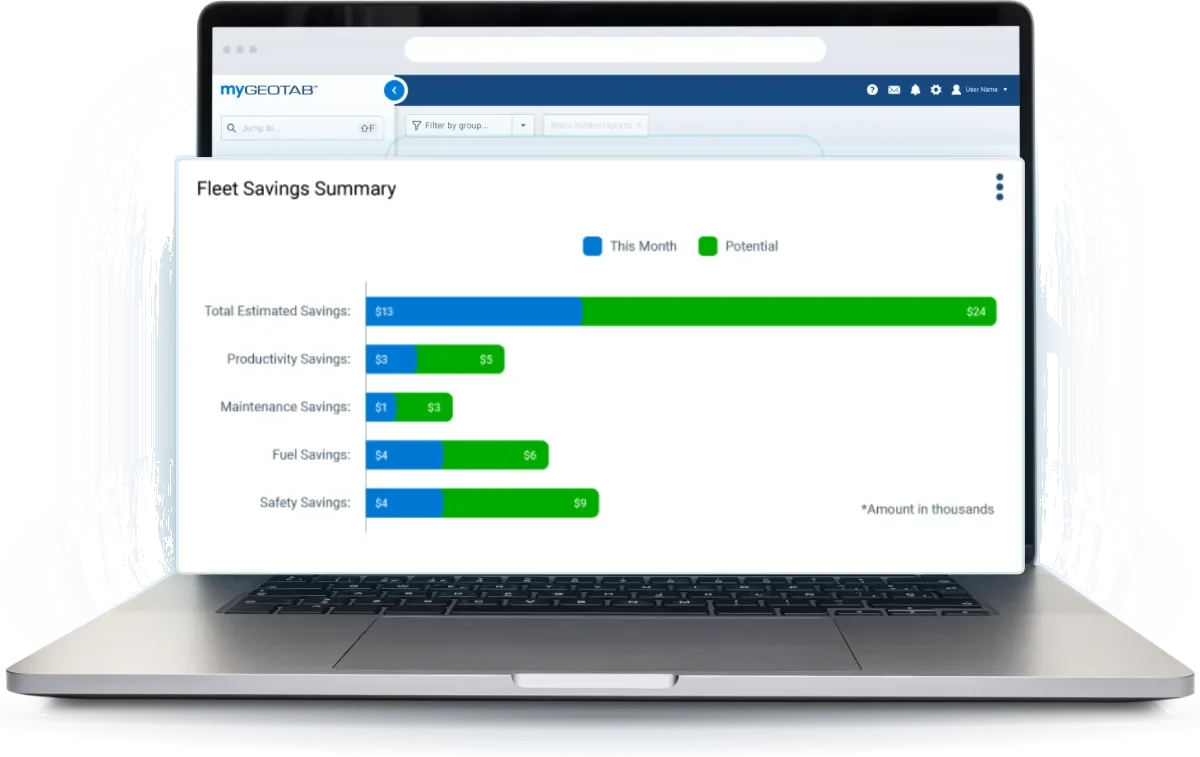
Fleet tracking earns its place in the budget line by line. Fuel, payroll, repairs, vehicles that sit, claims and premiums are costs you already carry, and each one moves once you can see what every vehicle is doing.
Here is where Geotab puts that money back, with the sourced number behind each return, starting with the one most fleets see first.
Across a large or multi-site fleet, any one of these lines is large enough to matter. Together, they make the fleet tracking ROI case your finance office will ask to see. After the six lines, we cover public agencies, mixed and multi-site fleets, the screens that measure each line and the steps to build that case yourself.
ROI at a glance
Fuel and Idling: The First Fleet Tracking Return
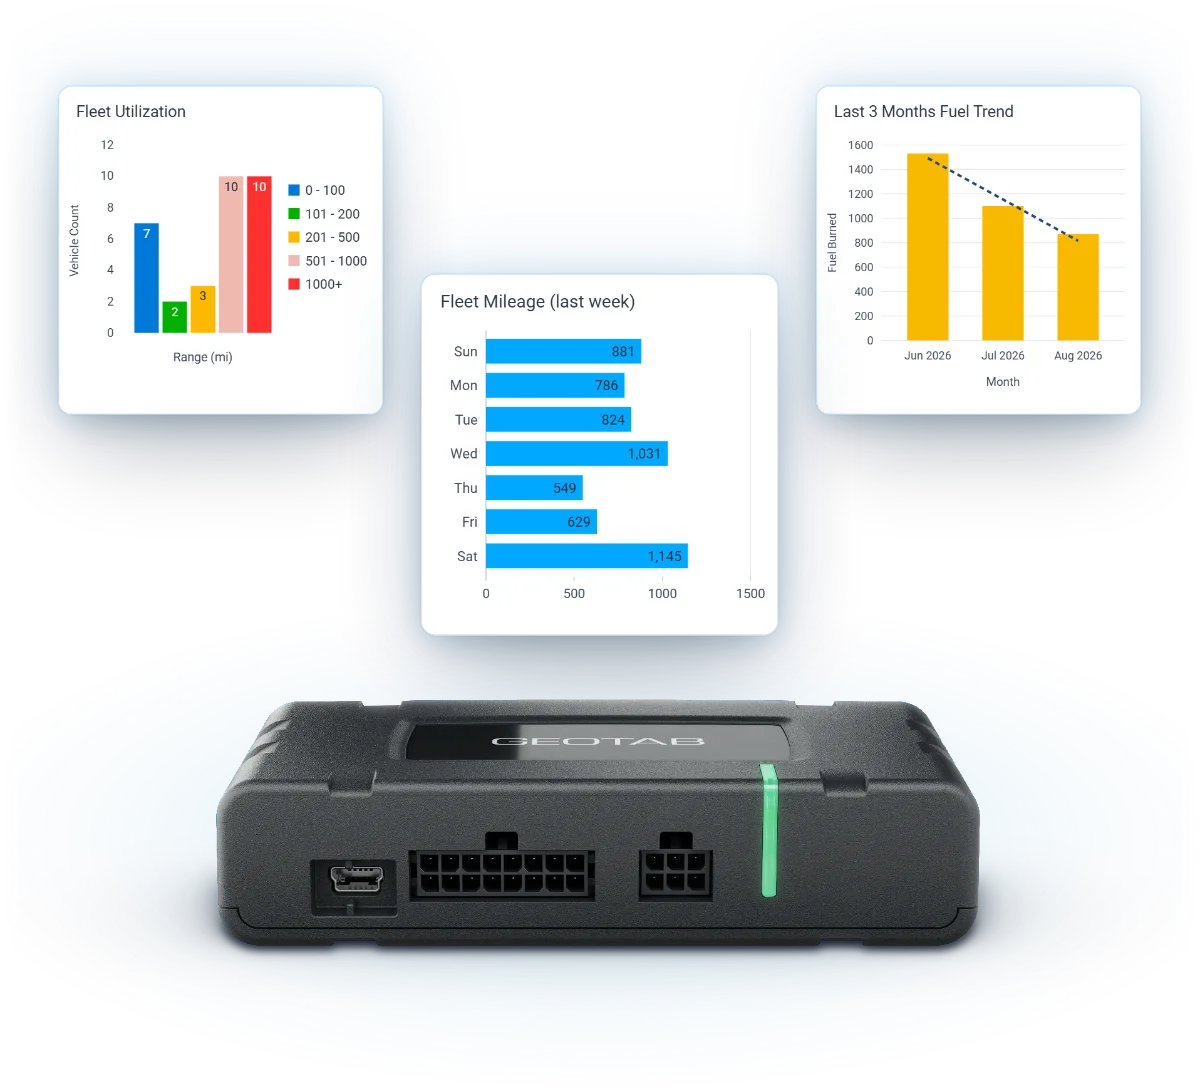
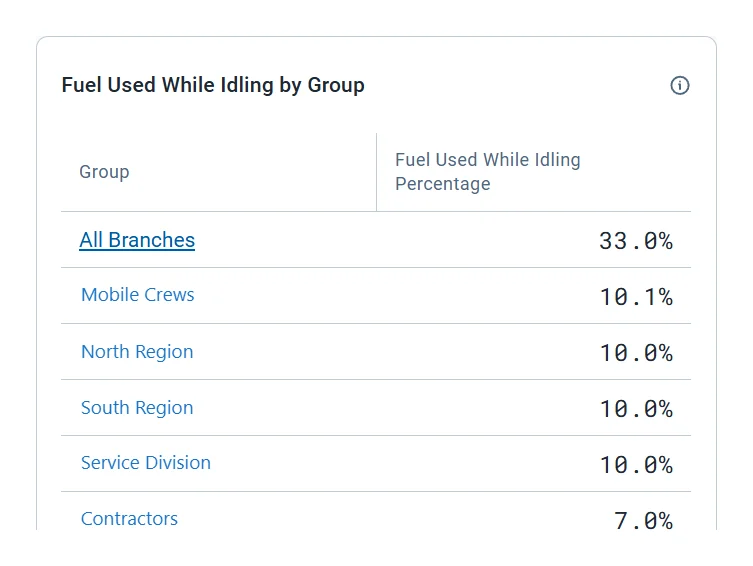
Idle fuel comes back first, because it needs only visibility. Geotab ranks idle time by vehicle, driver and location, with the fuel cost attached to each. Preventable idling is split out automatically, so you coach what can change.

Fuel Transactions matches every fuel-card purchase to the vehicle and flags location, tank-size and fuel-type mismatches for review. At the pump, the Geotab Fleet Card carries fuel discounts at 34,000+ U.S. locations, including 42¢ a gallon in diesel savings at 4,200+ truck stops (late-2025 average).
Routing adds a second fuel return: Geotab reports 15 to 30% fewer miles for fleets on Geotab Routing & Optimization.
One client's first month, in their words:
“We saw $5,500 in fuel savings in the first month. The impact was much greater than we expected. It was shocking!”The Fence Company, Raleigh, NC
The full fuel breakdown is in our post on how to reduce fleet fuel costs.
Labor and Overtime: Payroll Hours Back on the Books
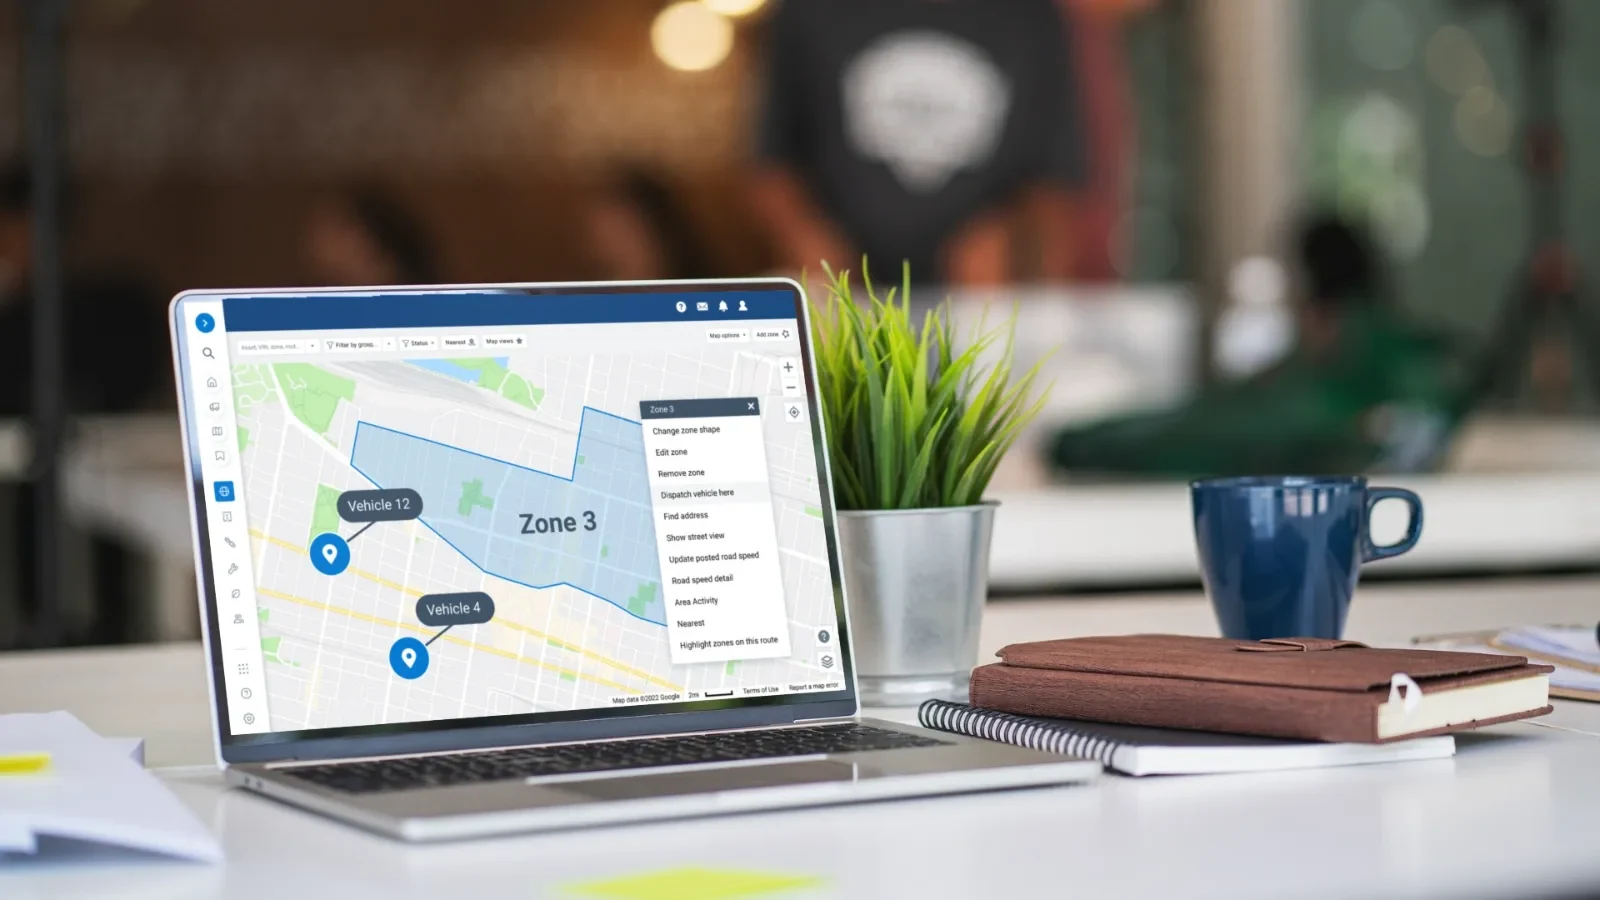
Every field hour on payroll has a trip behind it. Trip history in MyGeotab shows actual routes and stop times, so the hours on a timesheet can be checked against the hours on the road. Geofence each contract site and every visit logs arrival, duration and departure automatically.
For one of our clients, that visibility went straight to payroll:
“We found so much time wasted in every vehicle, and with every driver. It took us literally one week to understand the impact and reality of our return. We are saving 40 to 45% on overtime payroll, over $18,000 per month. It is truly amazing.”T&D Solutions, Alexandria, LA
Routing adds capacity on top. Geotab reports 2 to 3 more jobs per technician per day with routing. Below about five stops per driver per day, built-in dispatch covers you. Above it, we add route optimization.
See where those hours go in our post on GPS tracking and overtime payroll.
Maintenance and Utilization ROI: Fewer Breakdowns, Fewer Vehicles That Sit
Reactive maintenance costs 2 to 5 times more than preventive maintenance (McKinsey & Company), and the average roadside breakdown costs about $1,200 (NPTC Benchmarking Survey). Geotab moves that repair from the roadside to the bay.
Geotab Intelligence predicts vehicle failures and ranks them by actual risk, and flags failing batteries before vehicles leave the yard. Labor, parts and vendor costs per order roll into per-vehicle history, so repair-versus-replace is arithmetic. More in our post on Geotab fleet maintenance ROI.
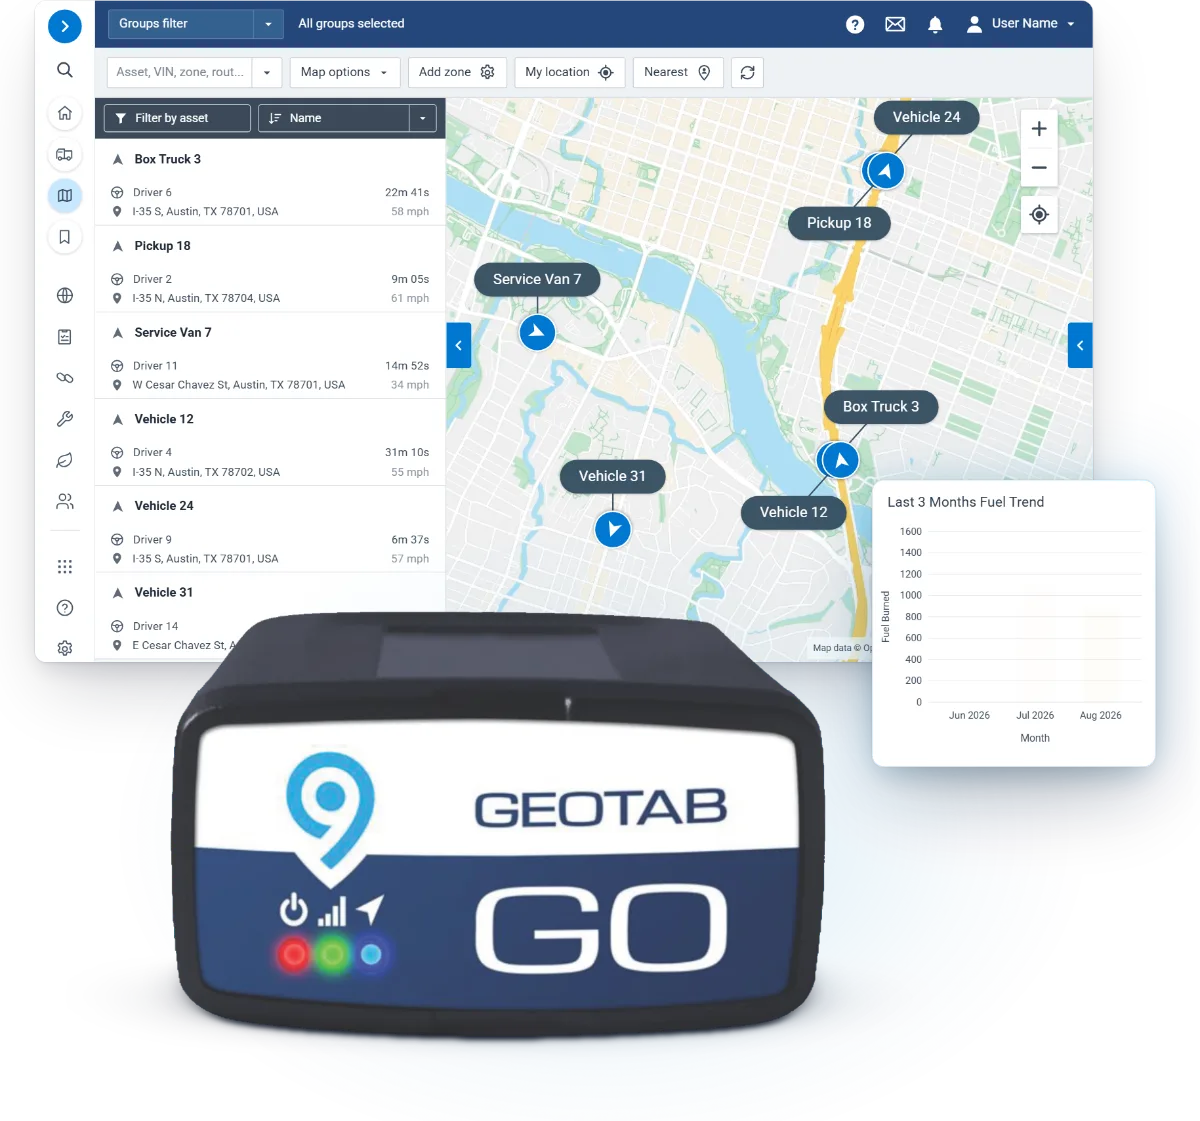
Then look at the vehicles that sit. Vehicles are active only 186 days per year. The Asset Utilization page shows days used, hours used, distance, and idle versus drive time for every asset, with trends and right-sizing insights.
The cheapest vehicle to run is the one you stop paying for. Our post on fleet right-sizing shows how utilization data finds it.
See every cost lever, and the MyGeotab screen that finds it, on our Geotab fleet cost savings page.
Safety and Insurance ROI: Fewer Collisions, Lower Premiums
One injury crash costs nearly $400,000 (FMCSA, 2024), which is why safety belongs in every telematics ROI case. Active users of Geotab's safety solutions achieve 28.7% fewer collisions than non-users.
Risk is concentrated. The riskiest 10% of drivers account for 1 in 5 collisions and are 7.4 times more likely to crash, so Geotab ranks which drivers are most likely to crash next, and coaching starts there.
Video adds proof and a coaching tool. Geotab's on-device AI flags 30+ road and driver behaviors, each one tunable, and a coaching session opens with the footage attached. Our post on dash cam ROI covers the rest.
Then the record goes to work on your premium. Insurance premiums run about $0.088 per mile, a ten-year high and roughly 5% of trucking operating costs (ATRI, 2023). Safer driving helps bring that cost down, and we help our clients make the case at renewal with Geotab records and insurer access you approve, and can revoke.
Fleet Tracking ROI for Public Agencies
Public works directors and fleet managers answer for every dollar, to a council, a board or an auditor. Geotab turns that answer into a report. 2,900+ public-sector customers run on Geotab, with 1 million+ public-sector subscriptions.
Geotab reports results at King Township (Canada, public sector): 10.9% less speeding in the first 30 days, a 7% collision-risk reduction and 6.4% better fuel efficiency with Geotab driver rewards.
Buying is part of the return, too. Eligible public agencies buy Geotab on Sourcewell contract 102924-GEO, valid through April 2029, with cameras and asset trackers on contract (Sourcewell, 2025). Where your procurement rules accept cooperative contracts, the solicitation and evaluation are already done, so your purchasing office reviews the award instead of running a new one, and we prepare the quote, the contract citation and the PO language your buyer needs.
The full public-sector case is in our post on public fleet telematics ROI.
Fleet Tracking ROI for Mixed and Multi-Site Fleets
The six lines above land differently on each kind of asset. A van, an excavator and a trailer each return money in a different place, so a mixed fleet measures each one on its own terms.
Every asset class carries the tracker built for it, and all of them report to one MyGeotab account:
- Cars, vans and trucks on Geotab GO9 or Next-Gen GO10: every line in this post applies, from idle fuel and overtime to collision risk and premiums.
- Heavy equipment on GO Rugged: the return is in hours. Real engine hours land automatically, so service intervals and utilization run on the machine's own count, and you see which machines earn and which ones sit before you rent another one.
- Trailers and unpowered assets on GO Anywhere: the return is in less rental spend on assets you already own. Hourly location for up to 10 years on a single battery, with nothing to wire or recharge, keeps every trailer and container on the map, and dwell-time alerts flag assets sitting idle too long.
Multi-site operations find the return by comparison. Every region, depot and job site runs as its own group in one MyGeotab account, so each manager sees their own numbers and leadership sees the roll-up across every site.
Rank the sites on the same report and the gaps stand out: one yard idles more than the rest, one region brakes harder, one department asks for more units while another site leaves its own parked. Because every site is measured the same way, on the same screen, the comparison holds up when finance asks where the money came from.
Before the first device ships, we build your groups, zones and rules, and we stay on the phone until every device reports.
Fleet Tracking ROI Reports in MyGeotab
A return finance will sign off on needs a screen behind every number. Here is where each line in this post shows up once your vehicles report:
- Fuel: the Idling Report carries idle time and its fuel cost, and Fuel Transactions carries every fuel-card purchase, with mismatches flagged.
- Labor: Trips History shows actual routes and stop times, and the Time Card Report shows first ignition to last ignition-off per driver, ready for each pay period.
- Maintenance: Risk of Breakdown is a percentage showing how likely this fault, on this vehicle, is to end in a tow. Battery health is scored out of 100, and Downtime Detection shows the hours each vehicle was actually unavailable, a real downtime cost per unit.
- Utilization: the Asset Utilization page shows which assets earn and which ones sit, and the utilization report lists days used, hours driven and idle-only days per asset.
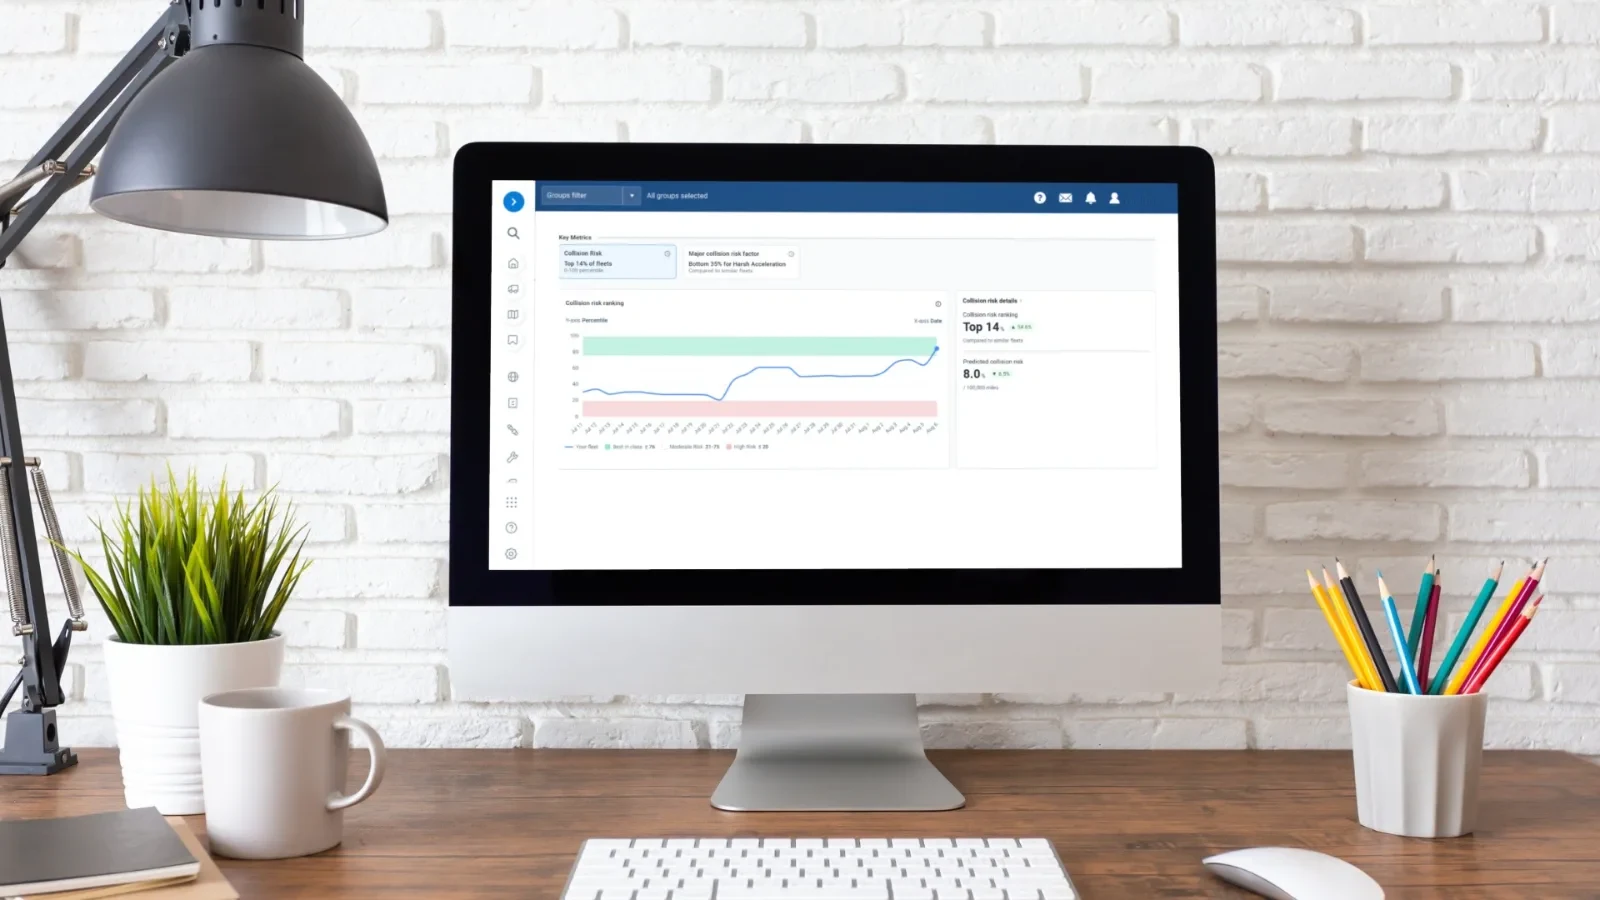
- Safety: the Safety Center ranks which drivers are most likely to crash next and tracks the trend, so coaching lands where it moves the number.
- Insurance: drivers per risk band, and how the bands moved since renewal, ready to hand to your underwriter.
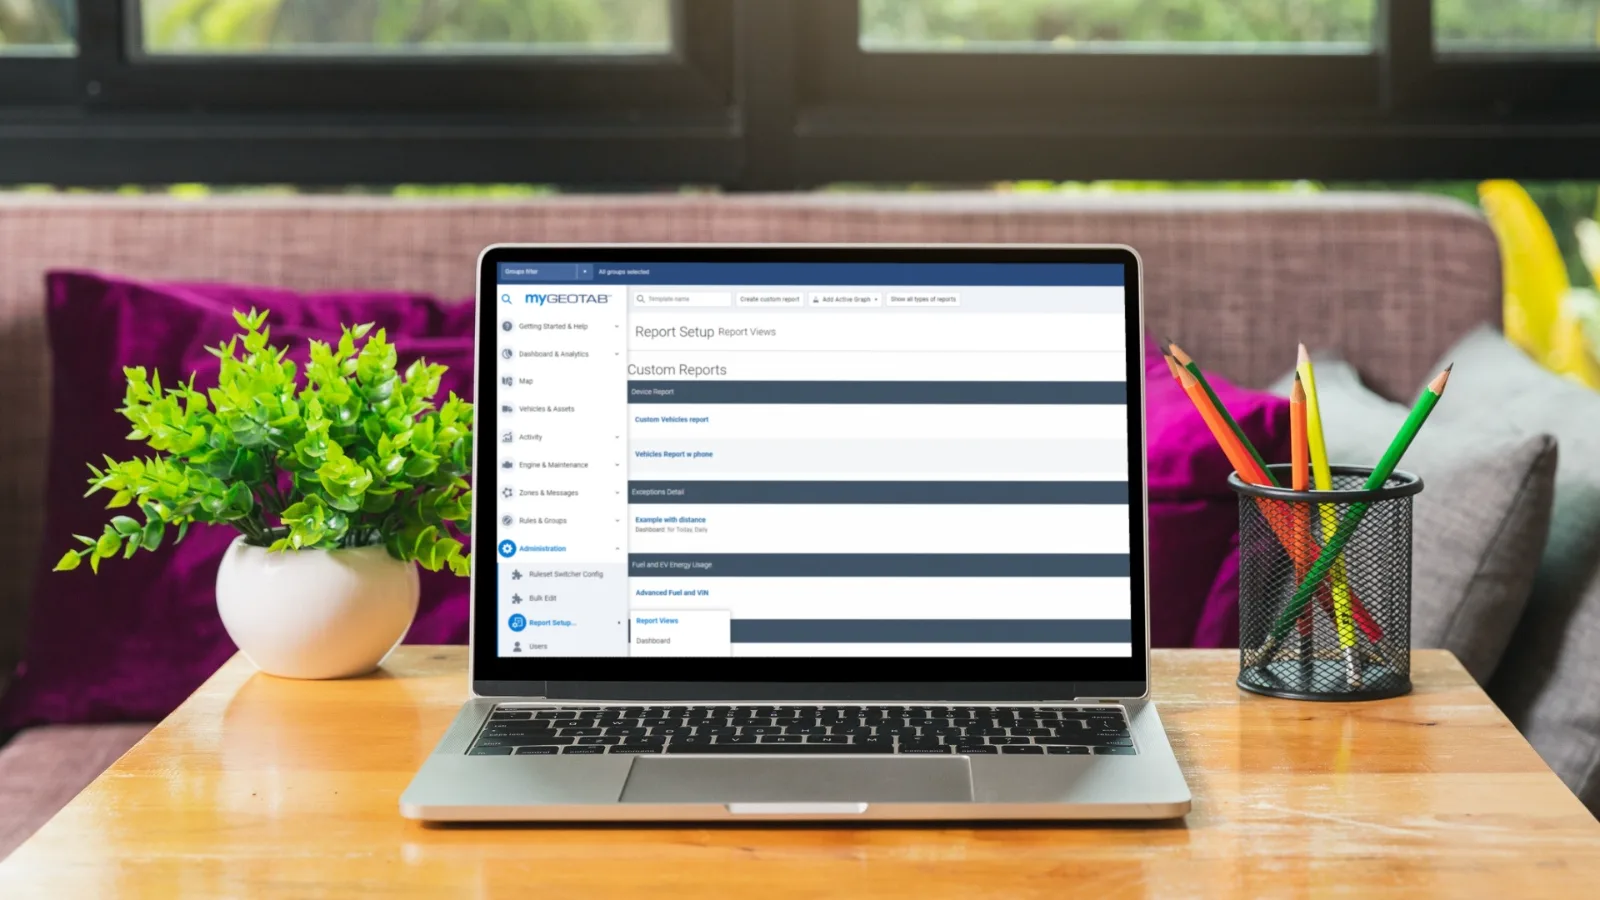
Three more tools keep those numbers in front of the people who sign. Active Insights ranks the biggest recoverable costs first, with the fix attached. Geotab Scheduled Reports email the figures to leadership daily, weekly or monthly, so the people who never log in still see them. For a question no report answers, ask Ace, the AI fleet assistant inside MyGeotab, in plain language and get the answer in seconds.
Petrey Novelty Inc puts that daily recap to work:
“We’re utilizing the email reports where we get a recap of the mileage, the violations, etc. They go out to management every day.”Petrey Novelty Inc, Luverne, AL
How to Build the Fleet Tracking ROI Case, Step by Step
A fleet tracking ROI case wins approval when every figure has a source and a screen behind it. Build it in this order:
Pull last year's fuel-card statements, overtime hours, repair and towing invoices, claims costs and premiums from your own books. That is your baseline, and finance already trusts it.
The case then shows how every number gets checked after you sign.
Research from McKinsey & Company, the NPTC Benchmarking Survey, FMCSA and ATRI shows the size of each cost. Geotab figures show what fleets on the platform measured. Client results show what one business saw, in its own words. Your demo data shows your own fleet.
The next section covers two ways: the idling calculator for a floor and a free demo device for your own data. Put the device on your busiest vehicle and do not announce the day it goes in, so the numbers reflect normal driving.
Operations owns the numbers, finance owns the baseline, IT reviews the platform and purchasing owns the contract. IT's answer is ready: the MyGeotab platform is FedRAMP Authorized (Moderate), and Geotab's security program covers ISO/IEC 27001:2022, SOC 2 Type 2 and FIPS 140-3 validated cryptography.
We set your first schedules up during the demo, so the people who approve the case keep seeing the same numbers, in the same format, on a set cadence.
- Labor40 to 45%“We are saving 40 to 45% on overtime payroll, over $18,000 per month.”T&D Solutions, Alexandria, LA
- Safety28.7%Fewer collisions for active users of Geotab's safety solutions than non-users
- Maintenance2 to 5xWhat reactive maintenance costs compared with preventive maintenanceMcKinsey & Company
- Fuel and routing15 to 30%Fewer miles for fleets on Geotab Routing & Optimization, Geotab reports
Two mistakes hide the return, even in a strong case:
- Counting idle fuel alone. Idling is the first line, not the whole return, which is why the calculator is a floor.
- Collecting data nobody reads. An idling report that never reaches a driver changes nothing. Scheduled reports and coaching sessions are what move the number.
See Your Own Geotab ROI Before You Sign
The research and client results above show where the money is. The number your CFO signs off on comes from your own vehicles, and there are two ways to see it.
First, put your own fleet size, pump price and idling target into the idling calculator on our cost savings page. It counts idle fuel alone, so treat it as a floor.
Then start with a free demo device on your own vehicles. We configure your demo device before it ships, and it ships within 72 hours. Vehicle trackers ship Plug-N-Play, so your own crew installs them, with no installer to schedule and zero downtime. Keep it only if the numbers convince you.
“Even though there were cheaper solutions out there, there is no doubt your solution has provided more value to our bottom line.”Alexander Contractors, Kansas City, MO
Once you sign, the Fixed Pricing Guarantee locks your price for the rest of the contract. Our dedicated U.S.-based team answers in minutes, and we have served fleets since 1999.
FAQ
What is the ROI of Geotab fleet tracking?
The ROI of Geotab fleet tracking comes from six places: fuel, labor, maintenance, utilization, safety and insurance. Geotab measures every one of them on the same platform that tracks your fleet.
How do I calculate fleet tracking ROI for my own fleet?
Start with the idling calculator on our cost savings page, then confirm it with a free demo device on your own vehicles. The calculator counts idle fuel alone, so treat it as a floor, and the demo device lets you read your own idle and engine data.
Is insurance part of the Geotab fleet tracking ROI?
Yes. Safer driving helps lower insurance costs, and we help our clients make that case with their insurer. Active users of Geotab's safety solutions achieve 28.7% fewer collisions than non-users, and your Geotab records serve as proof at renewal, with insurer access you approve, and can revoke.
Which reports show the return on Geotab fleet tracking?
The Idling Report, Fuel Transactions, the Time Card Report, Risk of Breakdown, Downtime Detection, the utilization report and the Safety Center each measure one line of the return. Geotab Scheduled Reports then email those numbers to leadership daily, weekly or monthly, so the people who sign off see them without logging in.
How does fleet tracking ROI differ for trailers and heavy equipment?
Each asset class returns money on a different line. Vehicles on GO9 or GO10 return on fuel, labor, maintenance and safety. Heavy equipment on GO Rugged returns on engine hours: service intervals and utilization run on the machine's own count, so you see which machines sit before you rent another one. Trailers on GO Anywhere report hourly location for up to 10 years on a single battery, so the trailers you own stay on the map.
What mistakes hide fleet tracking ROI?
The two that hide the most are counting idle fuel alone and collecting data nobody reads. Idling is only the first line of the return, ahead of labor, maintenance, utilization, safety and insurance. And an idling report that never reaches a driver changes nothing: scheduled reports and coaching sessions are what move the number.