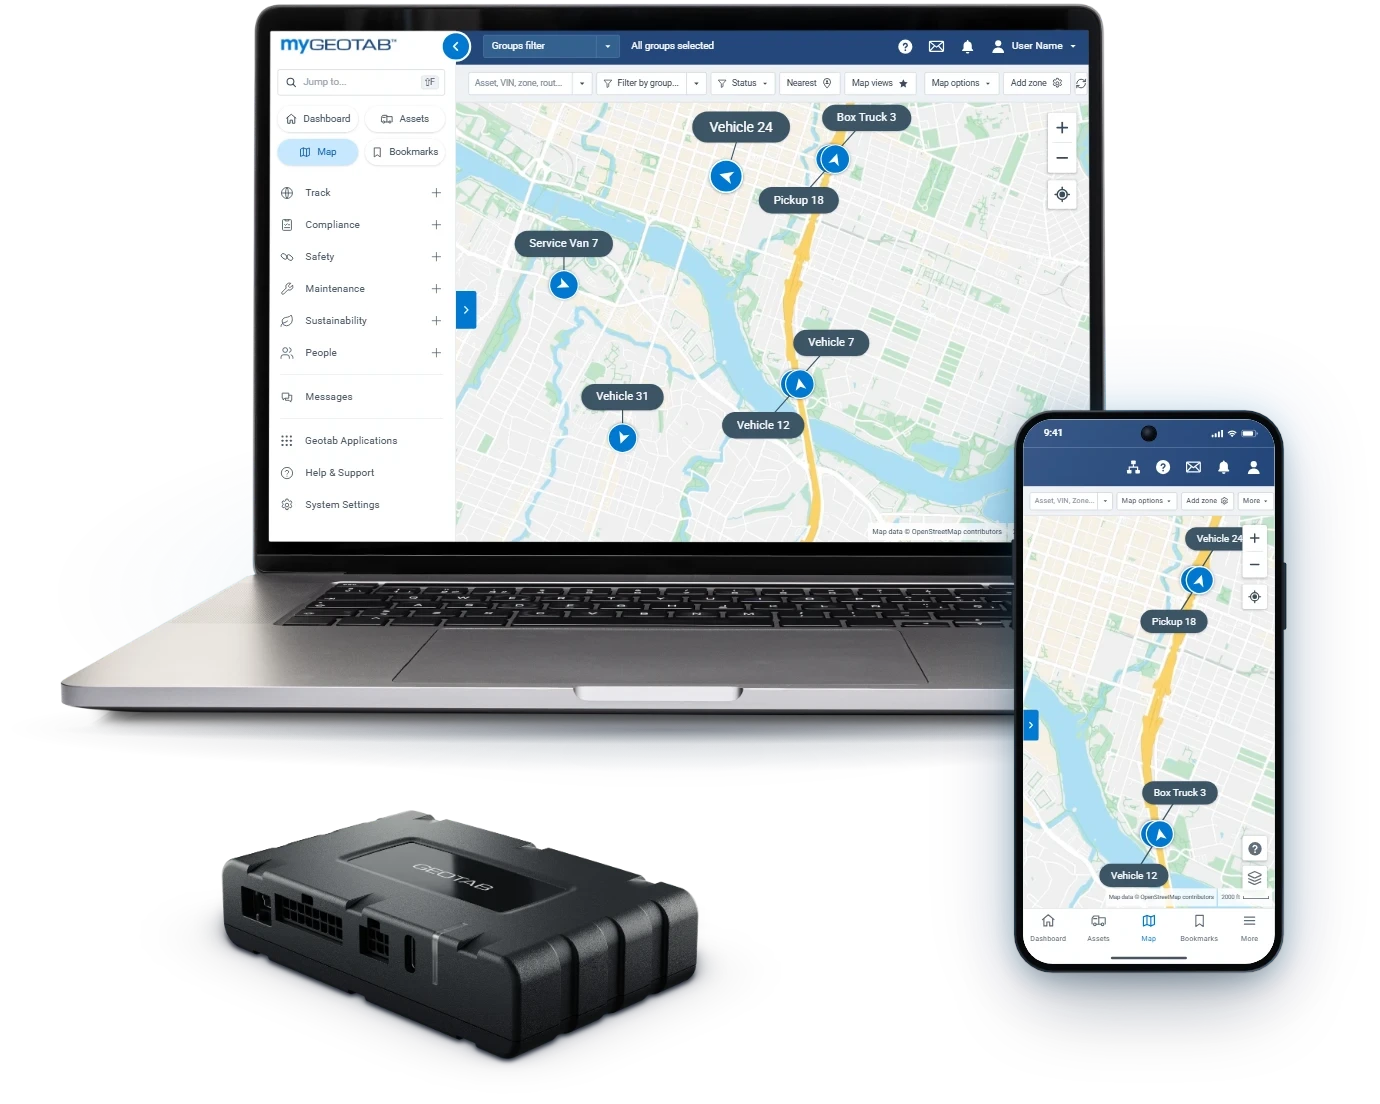
A city council, county board or utility commission approves fleet telematics for one reason: the return. Members want to know which vehicles earn their place, where the fuel goes, what a crash costs and why a repair bill came in high.
Public fleet telematics on Geotab answers each of those with a report your board can check. Below are the budget lines it moves, the MyGeotab report that proves each one, the sourced numbers to put in your staff report, and how to buy it with the competitive bid already done.
It holds for every public fleet that answers to a board: cities and counties, school districts and universities, utilities, and fire and public safety.
ROI at a glance
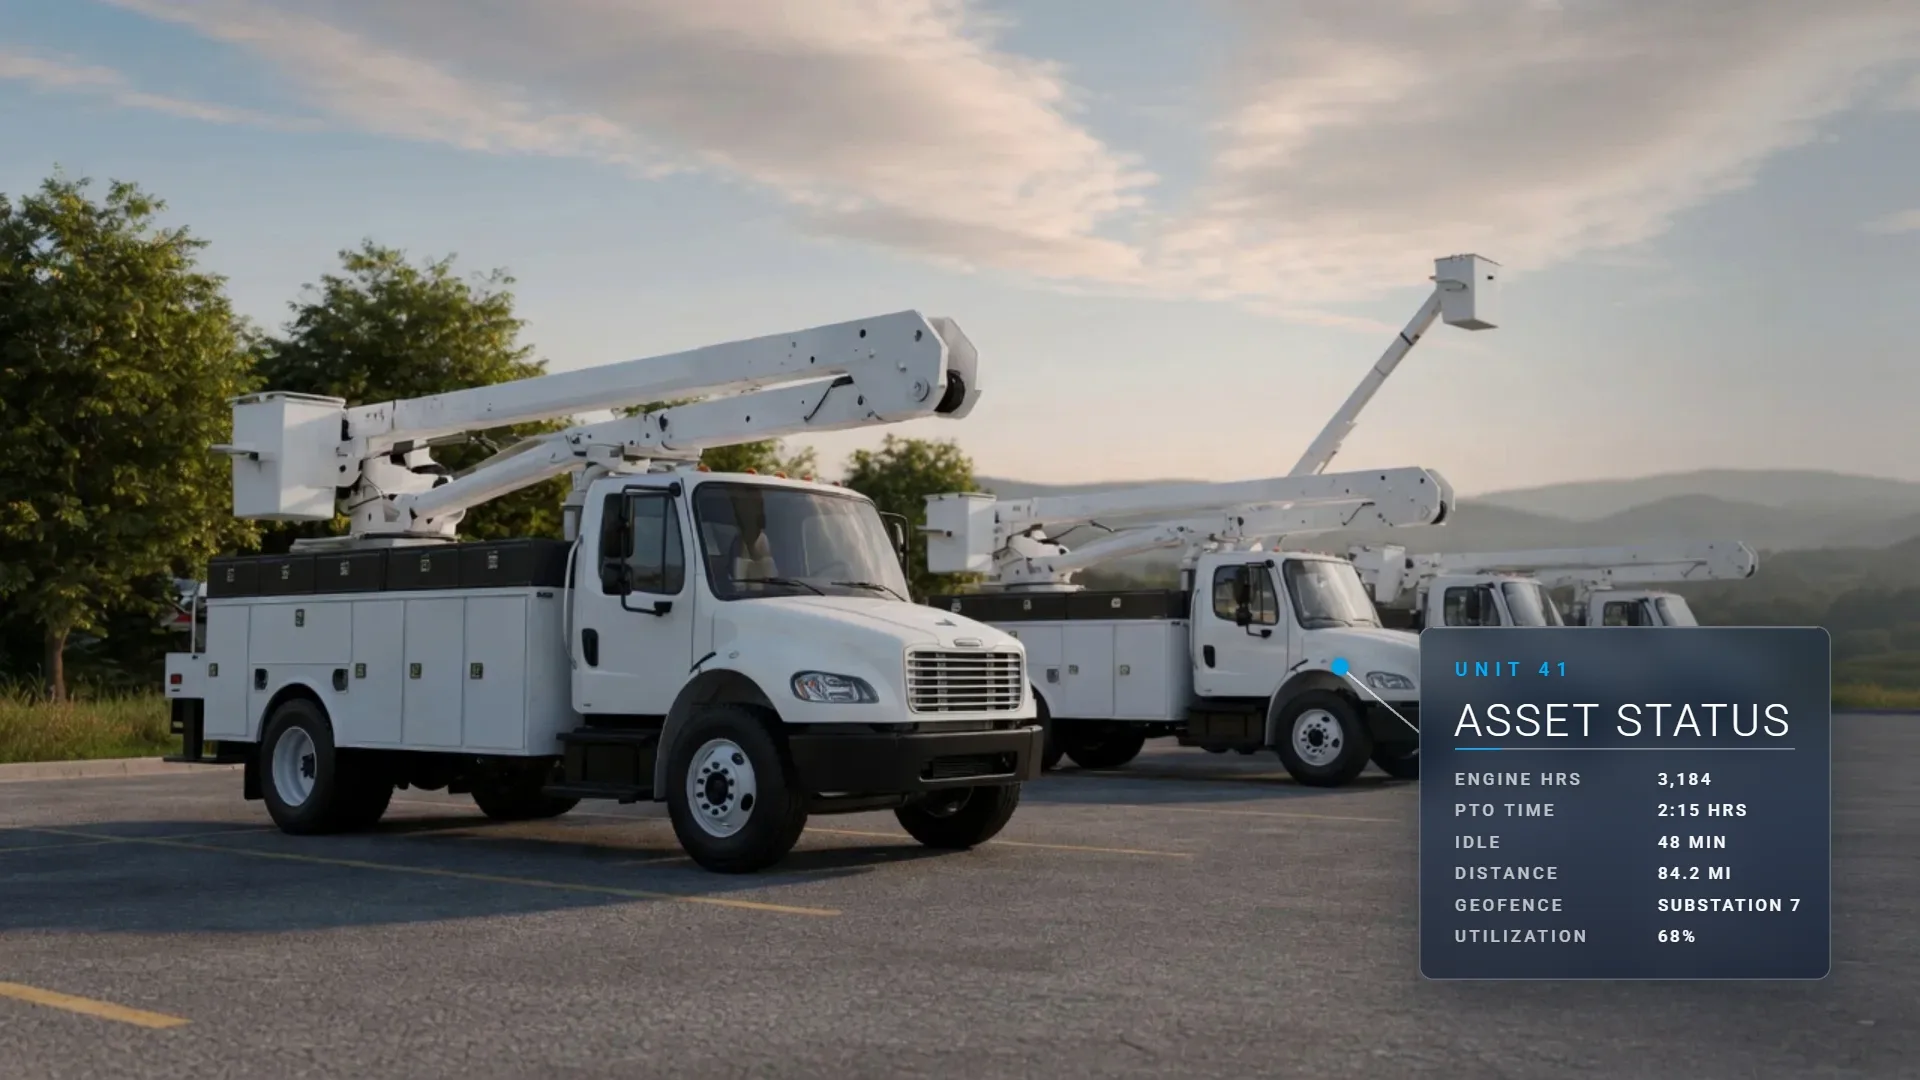
Right-Size a Government Fleet With Utilization Data
Every vehicle on the roster carries insurance, maintenance and a replacement date, whether it ran this week or not. Vehicles are active only 186 days per year.
Municipal fleet tracking shows which of yours fit that pattern. The Asset Utilization page shows days used, hours used, distance, and idle versus drive time for every asset, with trends and right-sizing insights.
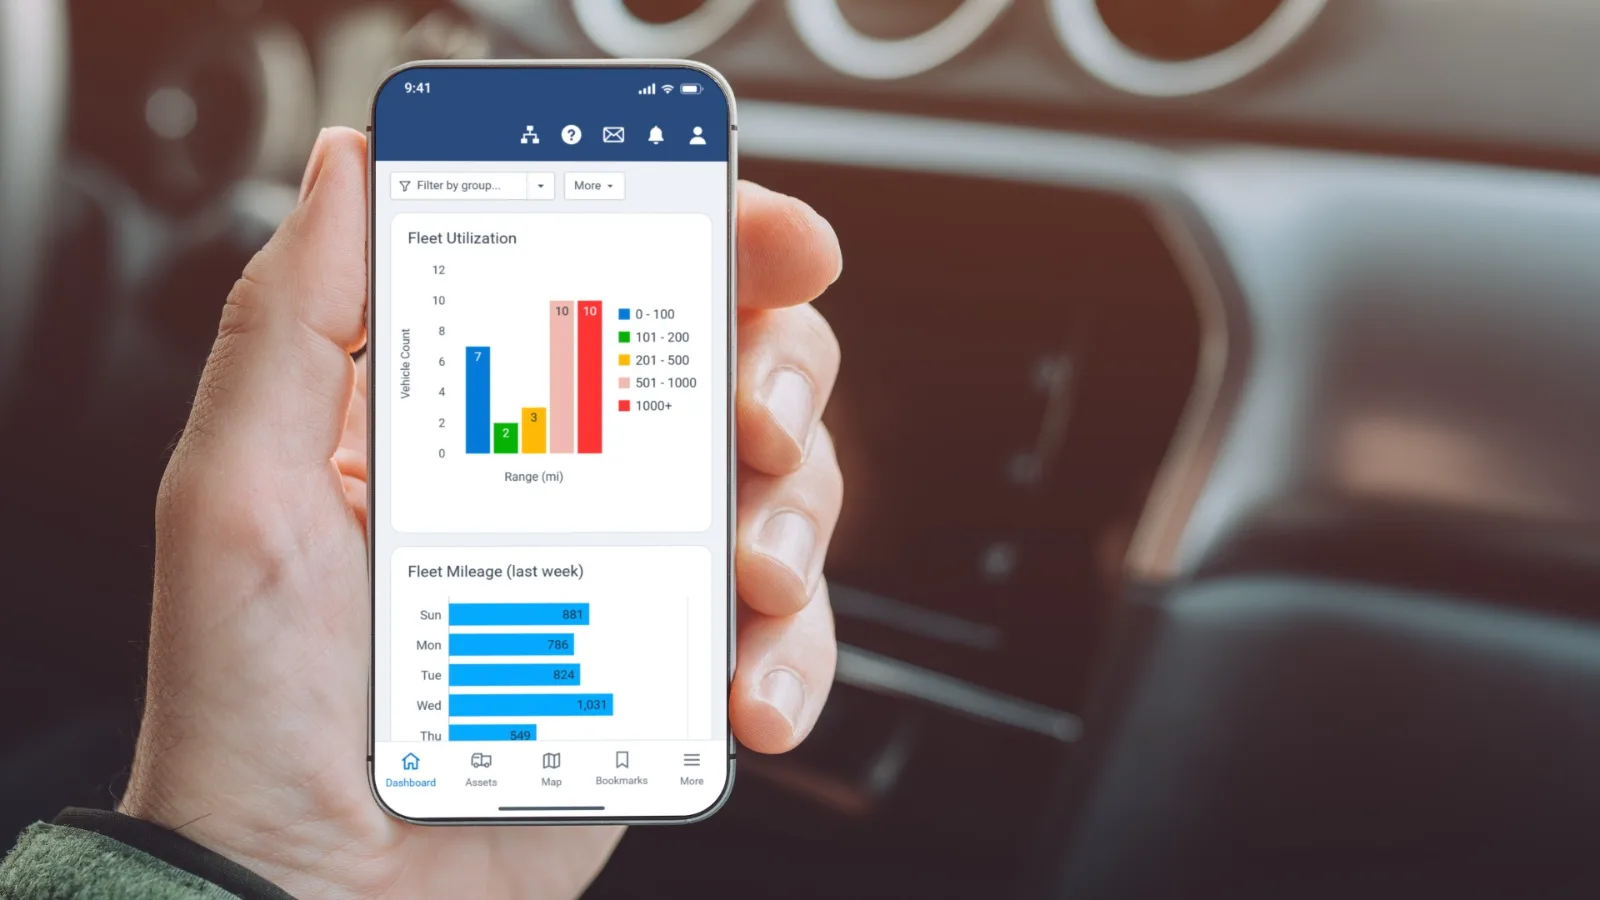
Filter it by department, yard or vehicle class, and read it by season. A plow that sits in July is waiting for its season. A pool sedan that sits in every season is a unit to reassign or retire.
Utilization data finds the vehicles that sit. The cheapest vehicle to run is the one you stop paying for, and utilization numbers justify every replacement request. Our post on fleet right-sizing shows how to find those units across every yard and department.
Fuel Accountability for Every Gallon of Public Money
Fuel is a line every council member reads, and every gallon is public money. Fuel Transactions matches every fuel-card purchase to the vehicle and flags location, tank-size and fuel-type mismatches for review.
Idling is the quieter leak. Preventable idling is split out automatically, so you coach what can change. Idle time is ranked by vehicle, driver, and location, with the fuel cost attached to each.
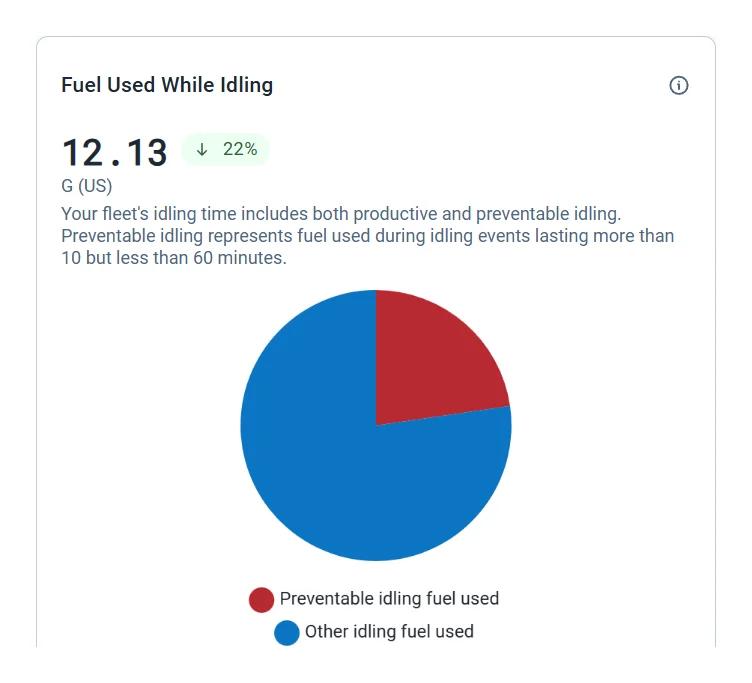
Warm-ups and PTO work sit outside that count, so a bucket truck running its boom is not scored as waste.
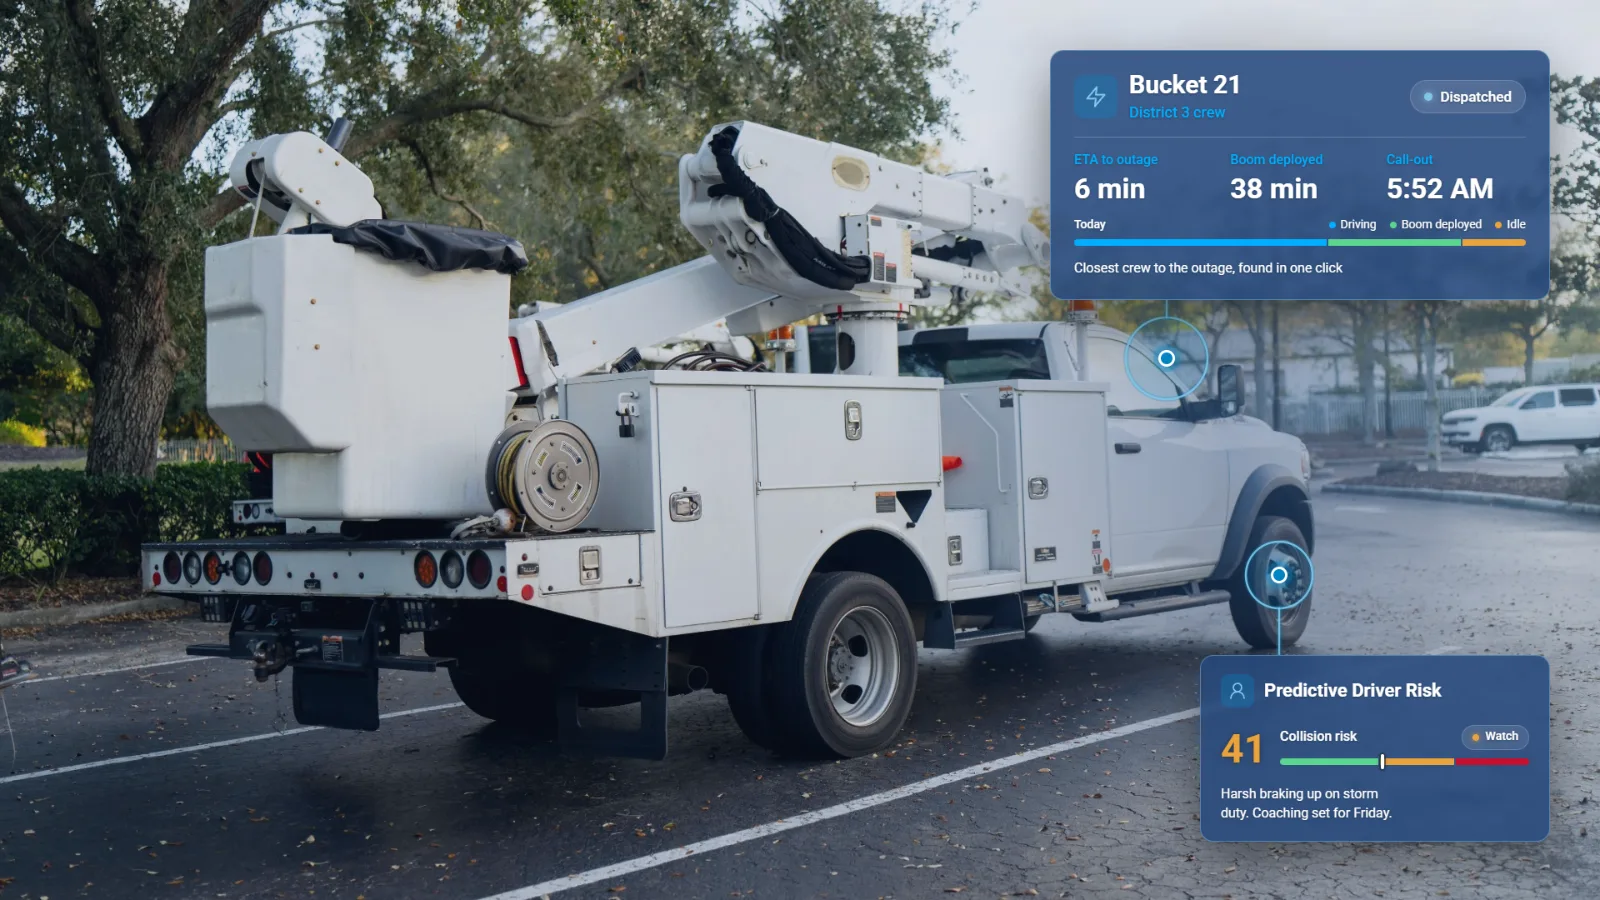
After-hours use is the other line councils ask about. Custom rule sets and geofences flag off-route travel, after-hours movement, and other rule events instantly. Idling and after-hours use are the savings that show up first, because they need only visibility.
To size it for your fleet, put your own fleet size, pump price and idling target into the idling calculator on our fleet fuel management and cost savings page.
Driver Safety Cuts the Liability Behind Every Public Vehicle
One injury crash costs nearly $400,000 (FMCSA, 2024). For a public fleet, that cost lands in a claims budget or a self-insurance fund.
Geotab finds the risk before the crash. The riskiest 10% of drivers account for 1 in 5 collisions and are 7.4 times more likely to crash, so coaching starts with them. Active users of Geotab's safety solutions achieve 28.7% fewer collisions than non-users.
Speeding multiplies the risk: severe speeding (20% above the limit) triggers a 7-fold surge in collision probability. Geotab reports what changed in one public-sector fleet. King Township (Canada, public sector): 10.9% less speeding in the first 30 days, a 7% collision-risk reduction and 6.4% better fuel efficiency with Geotab driver rewards.
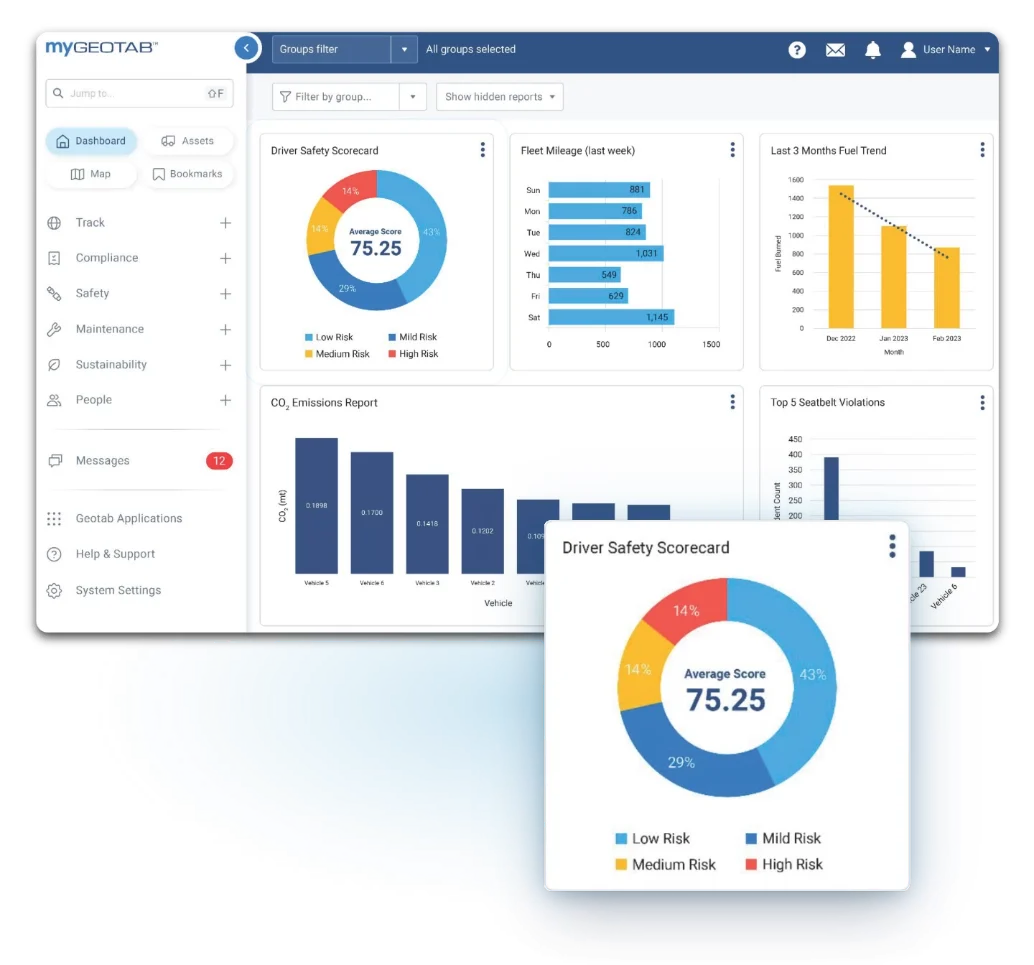
See how one agency account runs public works, public safety and transit with Geotab government fleet management.
Preventive Maintenance That Keeps Public Vehicles in Service
Reactive maintenance costs 2 to 5 times more than preventive maintenance (McKinsey & Company). The average roadside breakdown costs about $1,200 (NPTC Benchmarking Survey), before you count the missed work.
Geotab moves that work into the bay. Risk of Breakdown gives a percentage showing how likely each fault, on each vehicle, is to end in a tow, and battery health is scored out of 100. Plows are ready in November and mowers in May. In utility fleet management, critical units get the bay before storm season, not during it.
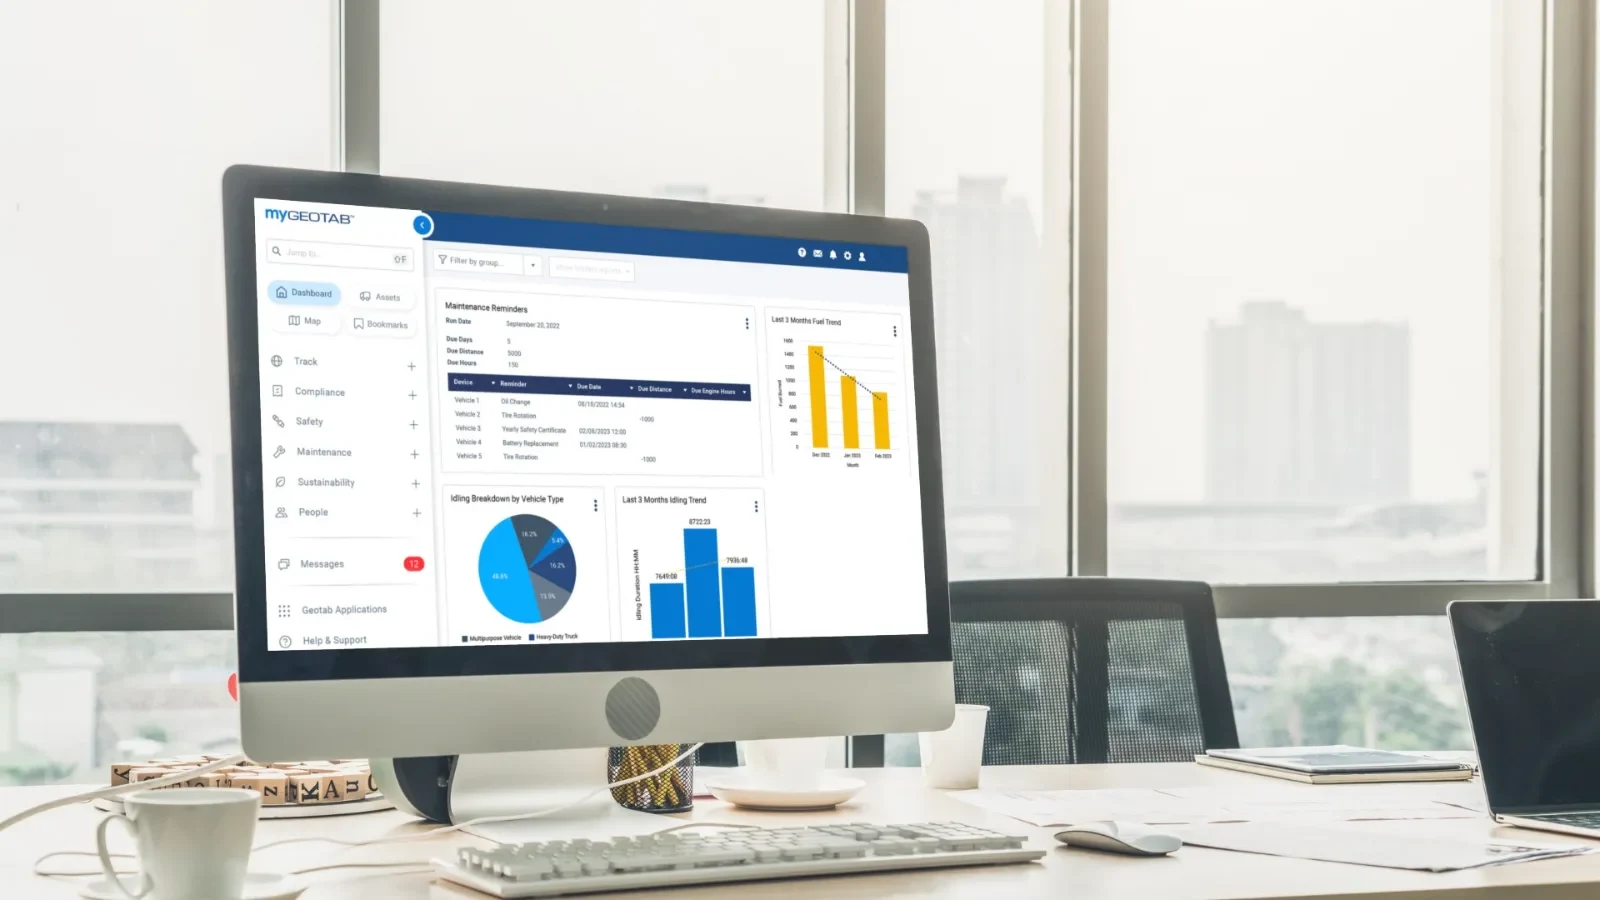
Downtime Detection shows the hours each vehicle was actually unavailable, a real downtime cost per unit. Labor, parts, and vendor costs per order roll into per-vehicle history, so repair-versus-replace is arithmetic your board can follow.
For California agencies, a failed CARB Clean Truck Check test automatically opens a high-priority work request with the test date, failure reason and deadline.
Proof of Service for Every Resident Call and Claim
When a resident calls to say a street was skipped, the trip history answers: which vehicle ran it, when, and on plows set up for it, whether the blade was down. Staff answer with facts, and the record backs up the operator too.
Citizen Insights adds the public side: a public map residents can check, on a 15-minute delay, built to reduce 311 call volume. See the full plow, sweeper and mower setup on our public works fleet tracking page.
When a claim arrives, Investigations turns a search of vehicle activity into a structured incident case, with notes, photos, police reports and dashcam footage, generally available since July 2026. Trip histories and audit logs export for public records requests, and retention follows your records policy.
In one client's words:
“The Active Tracking feature paired with your camera solution has positively affected everything. From driver safety, to truck maintenance, to proving false claims of missed pick-ups...it’s my peace of mind.”All Star Waste, Benson, NC
Mixed Public Fleets: Vehicles, Heavy Equipment and Trailers on One Agency Account
A public fleet is rarely one kind of vehicle. One agency can run pool sedans, police units, plow trucks, buses, loaders, mowers and trailers, and the return shows up differently on each:
- Vehicles: GO9 and GO10 trackers measure days used, distance, idle versus drive time, driving behavior and engine health, so the return lands in fuel, claims and right-sizing.
- Heavy equipment: GO Rugged is sealed heavy-duty tracking for loaders, excavators and other heavy equipment. Real engine hours land automatically, so service runs on the machine's own count and you see which machines earn and which ones sit before you rent another one.
- Trailers, mowers and generators: GO Anywhere gives hourly location for up to 10 years on a single battery, with nothing to wire or recharge. Battery asset trackers for trailers and mowers are on Sourcewell too.
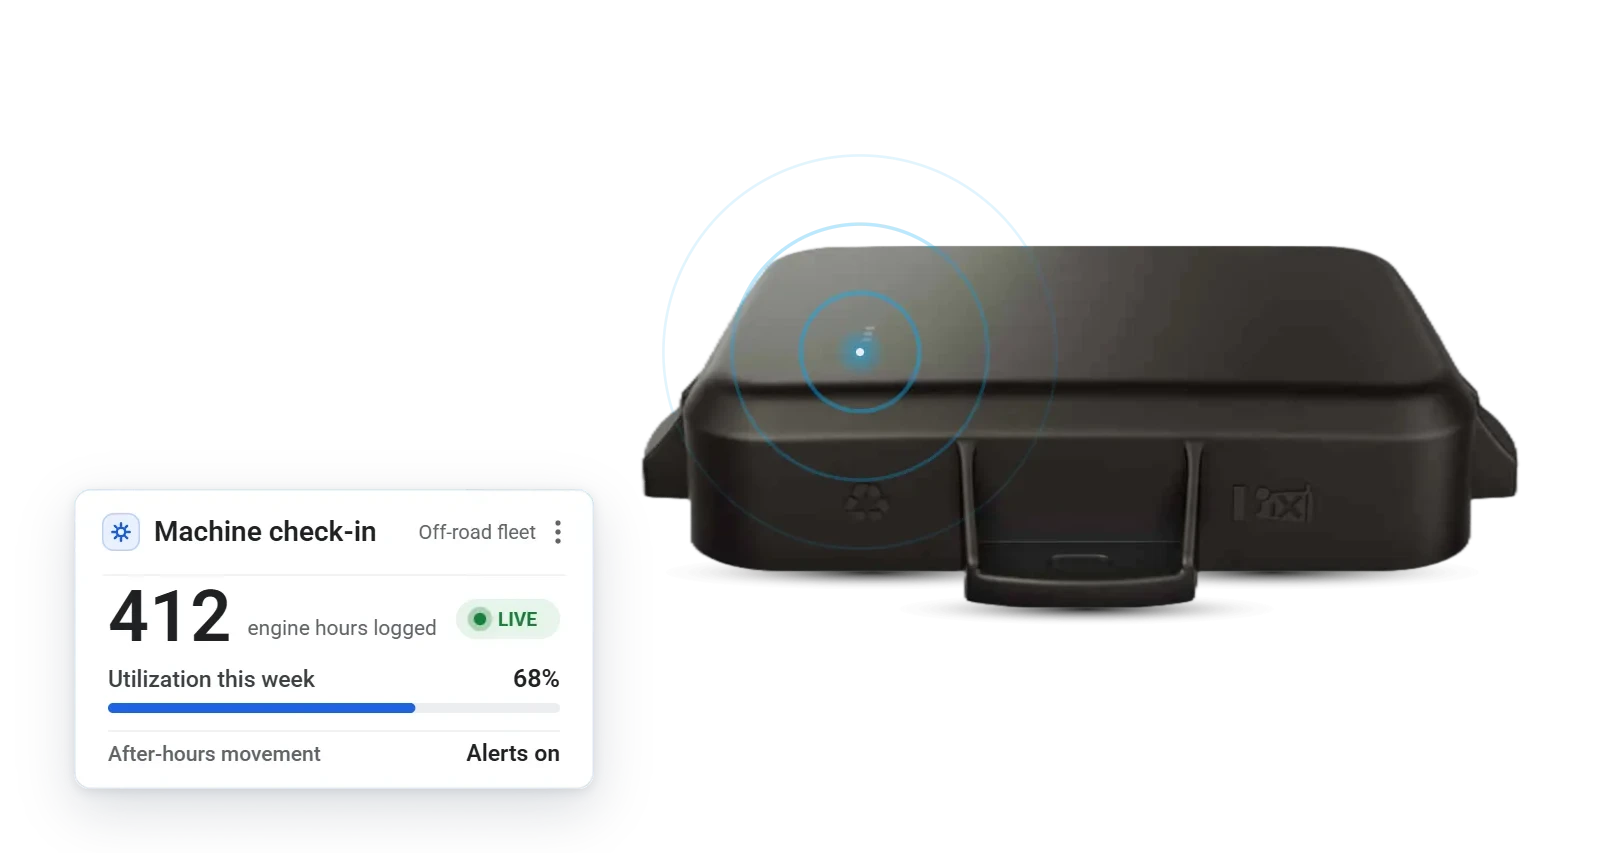
Every one of them reports into one MyGeotab account. Public works, public safety and transit each get their own view and permissions, and leadership sees all of it. Zone each yard, ward and district, and coverage reads by ward or district while the storm room sees all.
That single view is where right-sizing turns into transfers. The spare pickup parked at one yard fills another department's request before a new one goes into the capital plan.
MyGeotab Reports That Prove Each Budget Line to Your Board
Every budget line in your staff report has a MyGeotab screen behind it:
- Vehicle replacement requests: the Asset Utilization page, with days used, hours used and idle versus drive time for every unit.
- Fuel: the Idling report, ranked by vehicle, driver and location, and Fuel Transactions, with every fuel-card purchase matched to its vehicle.
- Claims and liability: driver risk, ranked before it becomes a claim, and an Investigations case file when one arrives.
- Repairs and downtime: Risk of Breakdown, Downtime Detection, and labor, parts and vendor costs per vehicle.
- Resident calls: trip history and route completion by street segment.
- Sustainability goals: the Sustainability Overview, with emissions intensity tracked monthly and exportable for council reporting.
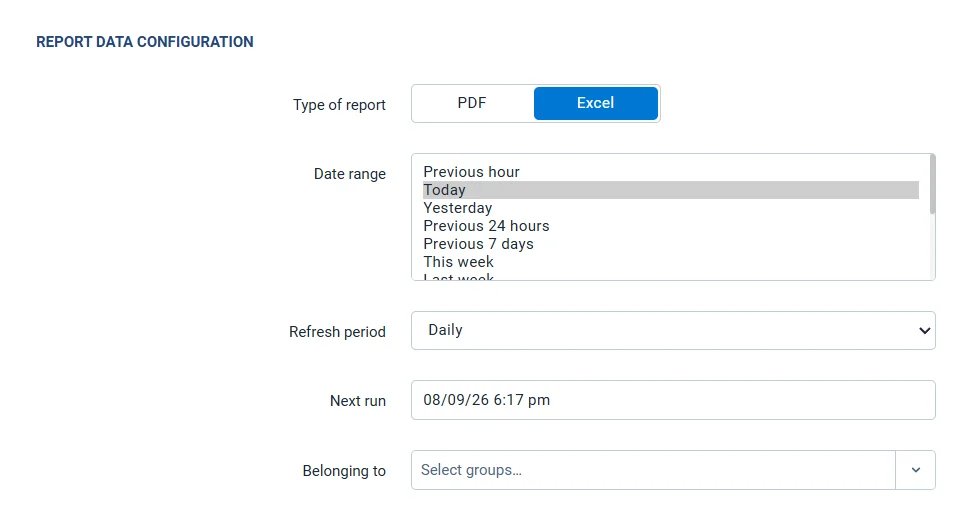
Geotab Scheduled Reports put those numbers in front of the people who vote. Each report emails daily, weekly or monthly, and each recipient can be filtered to their own group: the public works director sees public works, the police garage sees its own units, and the city manager gets the roll-up without a login.
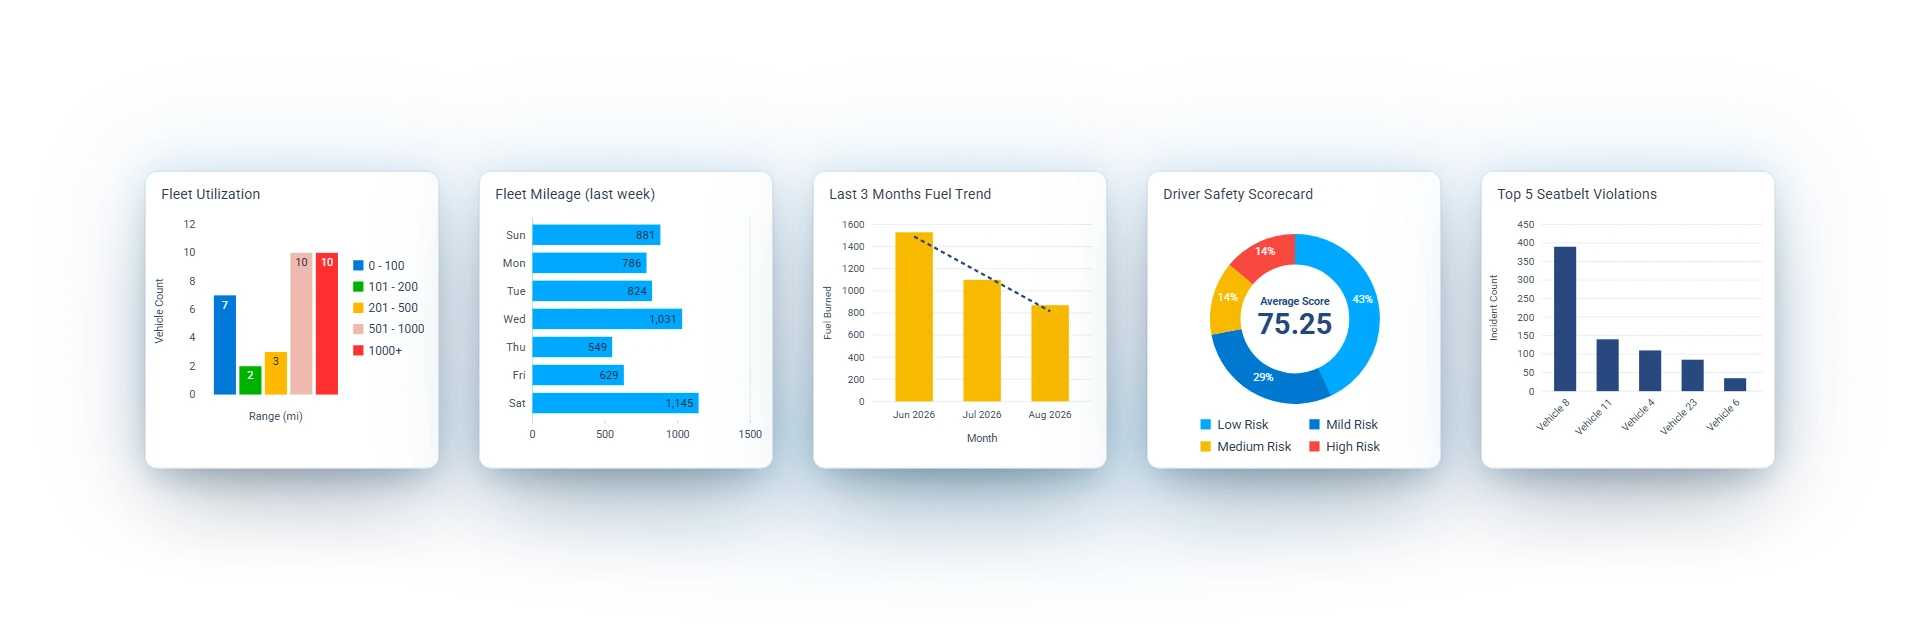
Fleet Telematics Business Case in Six Steps
The staff report is where telematics gets approved or tabled. Build it in this order:
Fuel, claims, repairs and replacement requests sit in every budget, so tie the case to them, not to features.
Put a free demo device on the unit you question most: the one you suspect sits, idles or keeps coming back to the shop.
Buy Public Fleet Telematics on Sourcewell
Once the board says yes, procurement is the next calendar. Geotab is on Sourcewell contract 102924-GEO, valid through April 2029, with cameras and asset trackers on contract (Sourcewell, 2025). NASPO ValuePoint MA3695 is also available through your state's participating addendum.
Where your procurement rules accept cooperative contracts, the solicitation and evaluation are already done, so your purchasing office reviews the award instead of running a new one. Sourcewell membership is free for public agencies, and many already hold it. Read how to buy Geotab on Sourcewell step by step.
Your IT staff will review security, and the answer is ready: the MyGeotab platform is FedRAMP Authorized (Moderate), and Geotab's security program covers ISO/IEC 27001:2022, SOC 2 Type 2 and FIPS 140-3 validated cryptography. 2,900+ public-sector customers run on Geotab, with 1 million+ public-sector subscriptions. In 2026, Tennessee DOT (June) and New Hampshire DOT (July, telematics and AI cameras) chose Geotab, and the State of Connecticut DAS renewed for 3,600+ vehicles across 90+ agencies (July).
The strongest staff report uses your own vehicles. Start with a free demo device. Keep it only if the numbers convince you. We configure your demo device before it ships, and it ships within 72 hours. Vehicle trackers ship Plug-N-Play, so your own crew installs them, with no installer to schedule and zero downtime.
Before the first device ships, we build your groups, zones and rules, and we stay on the phone until every device reports. Once you sign, the Fixed Pricing Guarantee locks your price for the rest of the contract, a number your budget office can plan around. We have served fleets since 1999.
Support is part of the return, too. One client's verdict:
“Phenomenal staff training and technical support! There is no comparison between you and any of our other vendors. When we need assistance, someone is always available to take our call.”QuikTrip Corporation, Tulsa, OK
FAQ
How can a public fleet show telematics ROI to its council?
With reports, not estimates: utilization by vehicle, fuel-card purchases matched to each vehicle, driver safety trends and maintenance cost per vehicle, all from one MyGeotab account. A free demo device on your own vehicles puts your own fleet's data in those reports before anything goes to a vote.
Have Geotab driver rewards worked in a public-sector fleet?
Yes. Geotab reports results at King Township (Canada, public sector): 10.9% less speeding in the first 30 days, a 7% collision-risk reduction and 6.4% better fuel efficiency with Geotab driver rewards. Rankings and rewards give drivers a clear, positive reason to keep improving.
What does one injury crash cost a public fleet?
One injury crash costs nearly $400,000 (FMCSA, 2024), and for a public fleet that cost lands in a claims budget or a self-insurance fund. Active users of Geotab's safety solutions achieve 28.7% fewer collisions than non-users, and Geotab ranks which drivers are most likely to crash next, so coaching starts there.
How should a public fleet read utilization on plows, sweepers and mowers?
By season. Compare each seasonal unit with the months it serves, not the whole year, so a plow parked in July reads as ready while a pool sedan parked in every season stands out. The Asset Utilization page shows days used, hours used, distance, and idle versus drive time for every asset.
How does the council keep seeing the return after the vote?
Through Geotab Scheduled Reports. Utilization, idling, speeding and maintenance-due reports email daily, weekly or monthly to the people you choose, each filtered to their own group, so leadership sees the same numbers as the fleet office without logging in.