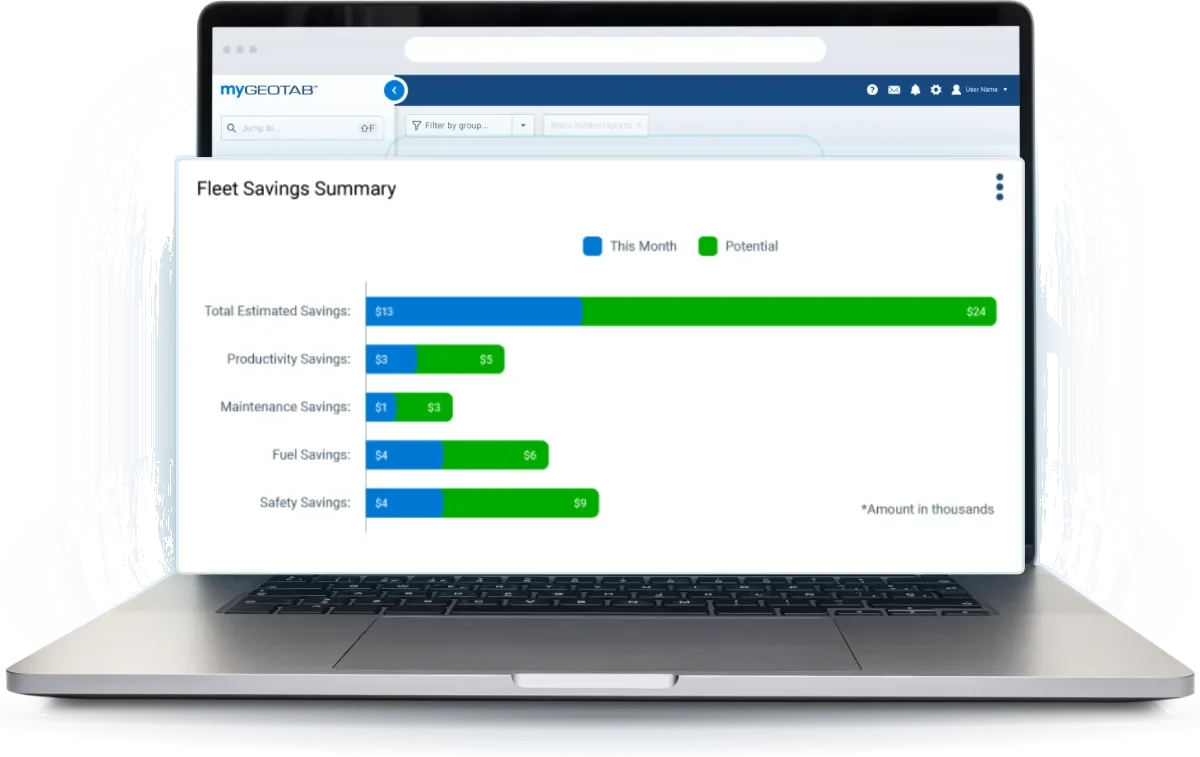
Every fleet budget has a line for new trucks and new equipment. The units already parked rarely get a line of their own, and that is where the money hides: the pickup nobody drives, the trailer that has not left the yard, the loader rented for one job while its twin sits at another.
Vehicles are active only 186 days per year. Geotab fleet utilization data shows which of yours are working and which are waiting, by vehicle, by asset and by site, so the next purchase order fills a real gap instead of buying a unit you already own.
ROI at a glance
“We had an idea of what was going on out there, but let me tell you something...we had no idea to the extent of how bad it really was. It has literally turned this company around.”Client verdict, in their own wordsMOS Electric, Nags Head, NC
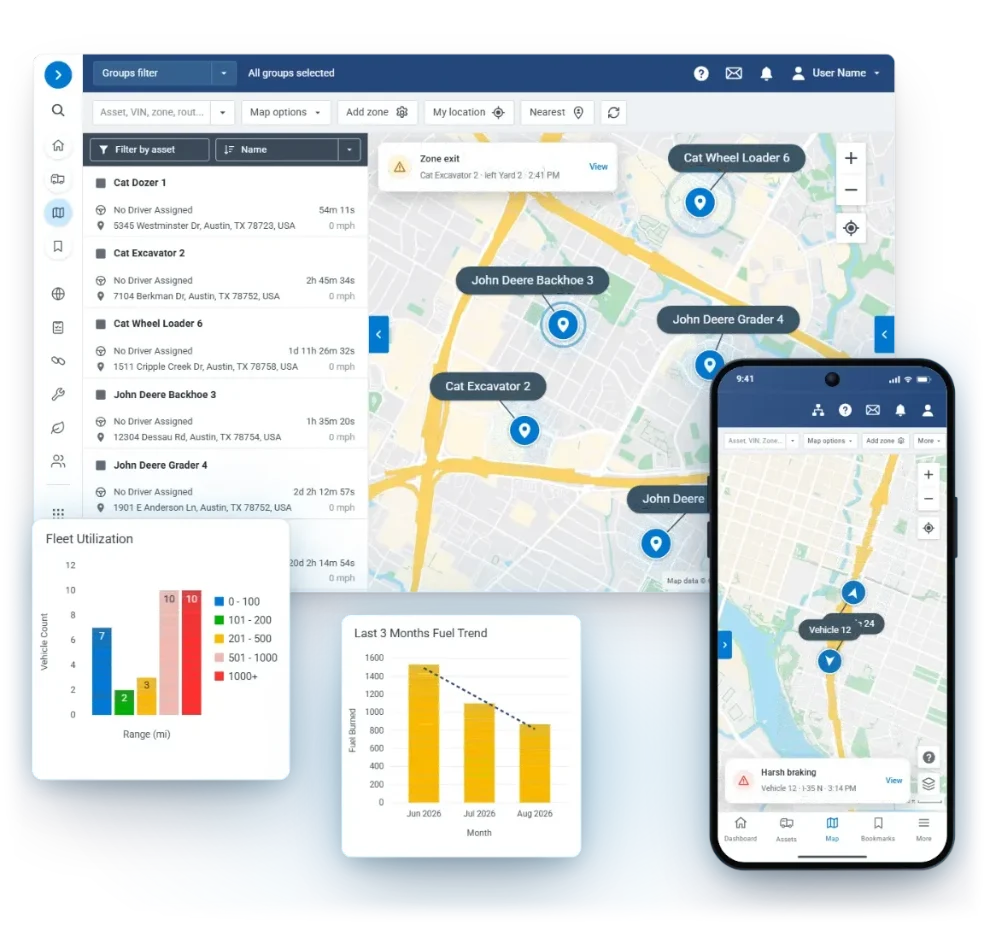
Fleet Utilization Data Shows Which Units Earn Their Keep
The Asset Utilization page shows days used, hours used, distance, and idle versus drive time for every asset, with trends and right-sizing insights. Filter it to any group you set up, such as a region, a depot or a department, and one screen settles the argument every fleet director hears at budget time.
Idle versus drive time matters as much as days used. A truck that starts every morning and idles through the shift looks busy on a calendar, and the utilization numbers show what it really did. Geotab's idling report ranks idle time by vehicle, driver, and location, with the fuel cost attached to each.
Utilization data finds the vehicles that sit. The cheapest vehicle to run is the one you stop paying for.
Fleet Utilization Metrics to Measure First
Right-sizing runs on a short list of numbers. Measure these per unit and per site before anyone argues about the budget:
- Days used: how many days each unit actually moved. A low count on a unit someone calls essential starts the right conversation.
- Hours used: the real working time, and on heavy equipment, the machine's own engine hours. A loader that barely ran cannot pass for a busy one.
- Idle-only days: days the engine ran and the unit went nowhere. A truck with a run of them is burning fuel to stand still.
- Distance and dwell time: miles on the vehicles, time sitting still on the trailers. Utilization rolls up per asset, so the trailer that never moves stops hiding.
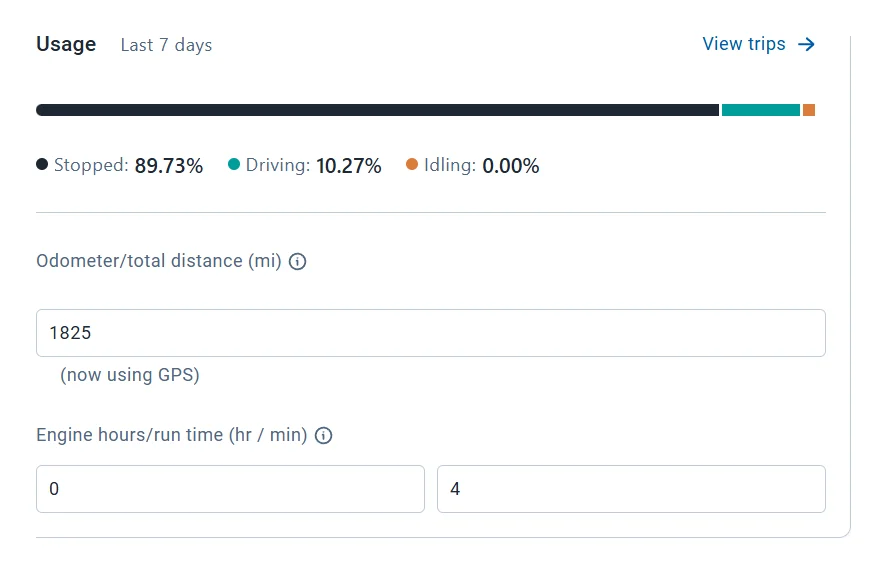
Each number has a home in MyGeotab. Days used, hours used and distance sit on the Asset Utilization page beside idle versus drive time, and the utilization report adds idle-only days per asset, the data behind a right-sizing call. Trips History shows actual routes and stop times, so overlapping routes show up before you approve another truck.
For the wider habit, our post on the first month of MyGeotab lists the five numbers every new account should watch.
Asset Utilization Tracking for Heavy Equipment and Trailers
Right-sizing stops short if only the trucks are visible. Geotab puts every asset class on the same map, each measured the way it works:
- Vehicles: GO9 and GO10 trackers record days used, distance, and idle versus drive time for every car, van and truck.
- Heavy equipment: with GO Rugged heavy equipment tracking, real engine hours land automatically, so you see which machines earn and which ones sit before you rent another one.
- Trailers and unpowered assets: GO Anywhere gives hourly location for up to 10 years on a single battery, with nothing to wire or recharge. Dwell-time alerts flag assets sitting idle too long.
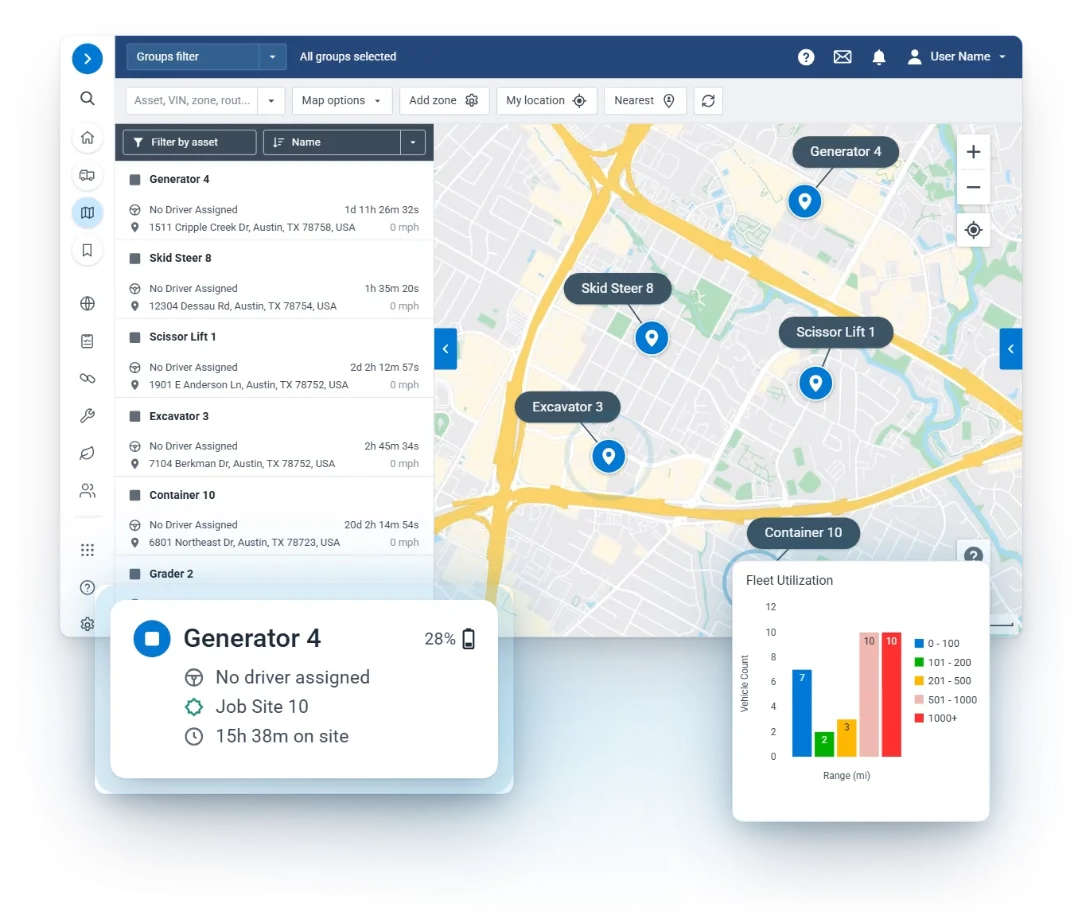
A mixed fleet needs every asset type measured on its own terms. Here is how KS Energy describes it:
“We are tracking a little over three-thousand assets; from pickups to off-road equipment, trailers, generators, compressors. Each type requires different reporting metrics. All our reports, dashboards and live alerts are personalized and formatted according to asset type and each of our users’ independent needs. This has been a game changer!”KS Energy, New Berlin, WI
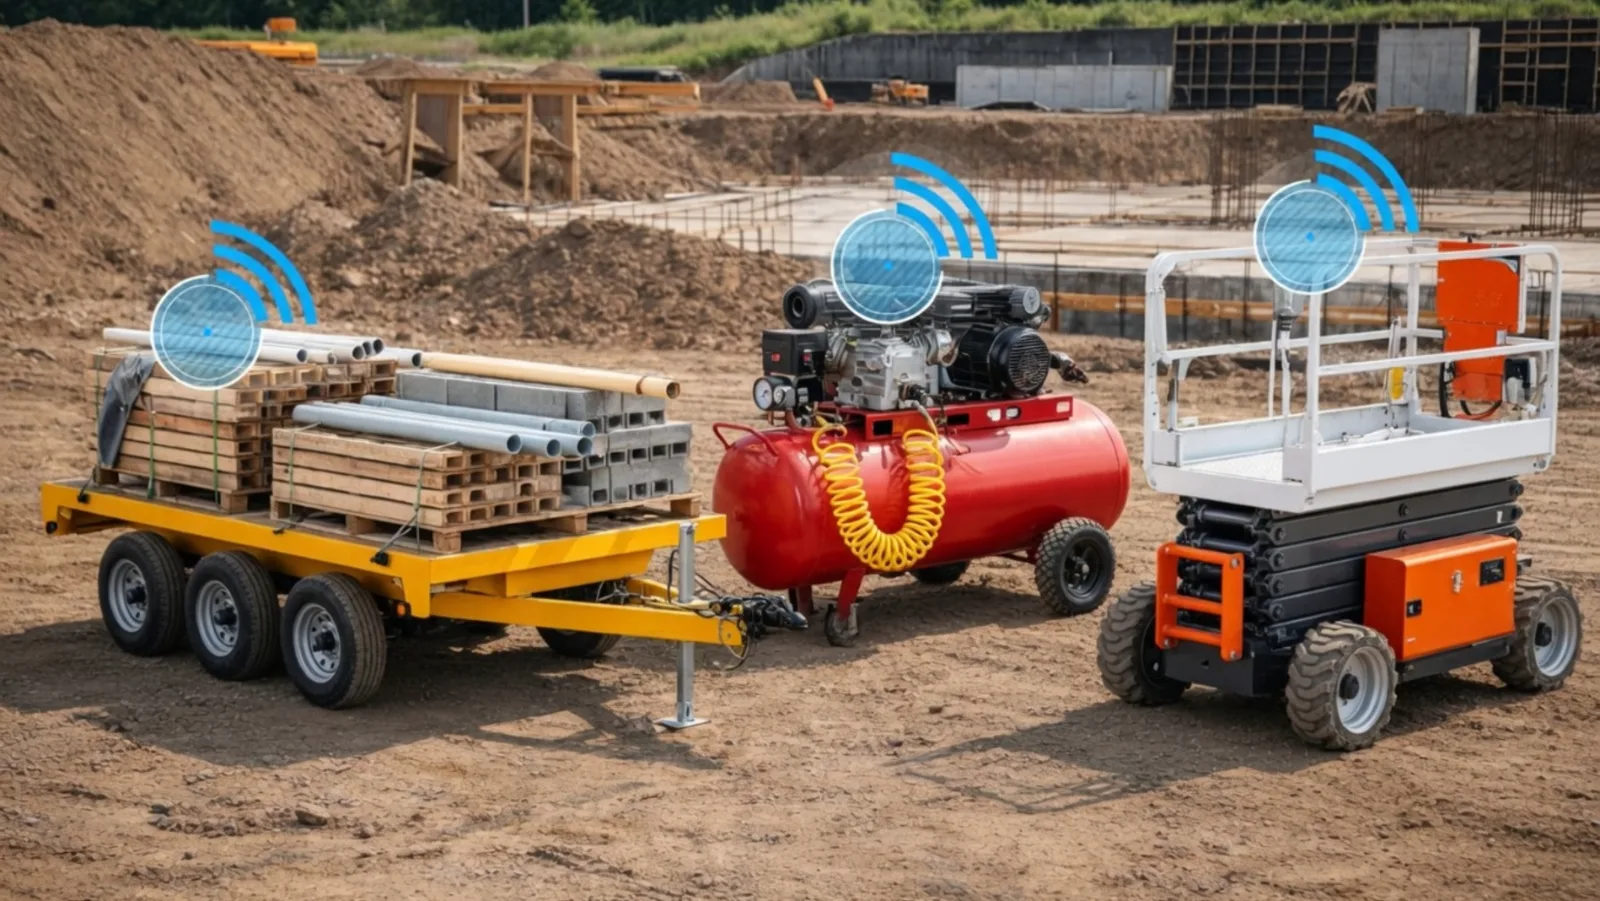
See every tracker and the assets each one fits on our Geotab asset tracking page.
Fleet Right-Sizing Across Sites: Move Units Before You Buy New
For a multi-site fleet, right-sizing is often a transfer, not a purchase. One depot runs short and asks for more trucks while another has units parked behind the fence. Without one view across every site, the purchase order gets approved and the parked units stay on the books.
Geotab runs every region, depot and job site as its own group in one MyGeotab account. Zone each site, and every machine's engine hours and time in zone land on that job automatically. Put the sites side by side and the moves show themselves: the yard with spare trucks, the job with a loader nobody has started, the department asking for a unit another department is not using.

Inside a single site, the answer is often a shared pool instead of one more assigned vehicle. Geotab Keyless brings digital keys and controlled vehicle access to shared vehicles and motor pools, managed from the same screen as your tracking, with every access on the record: who opened which vehicle, and when. Easy access means shared vehicles actually get shared.
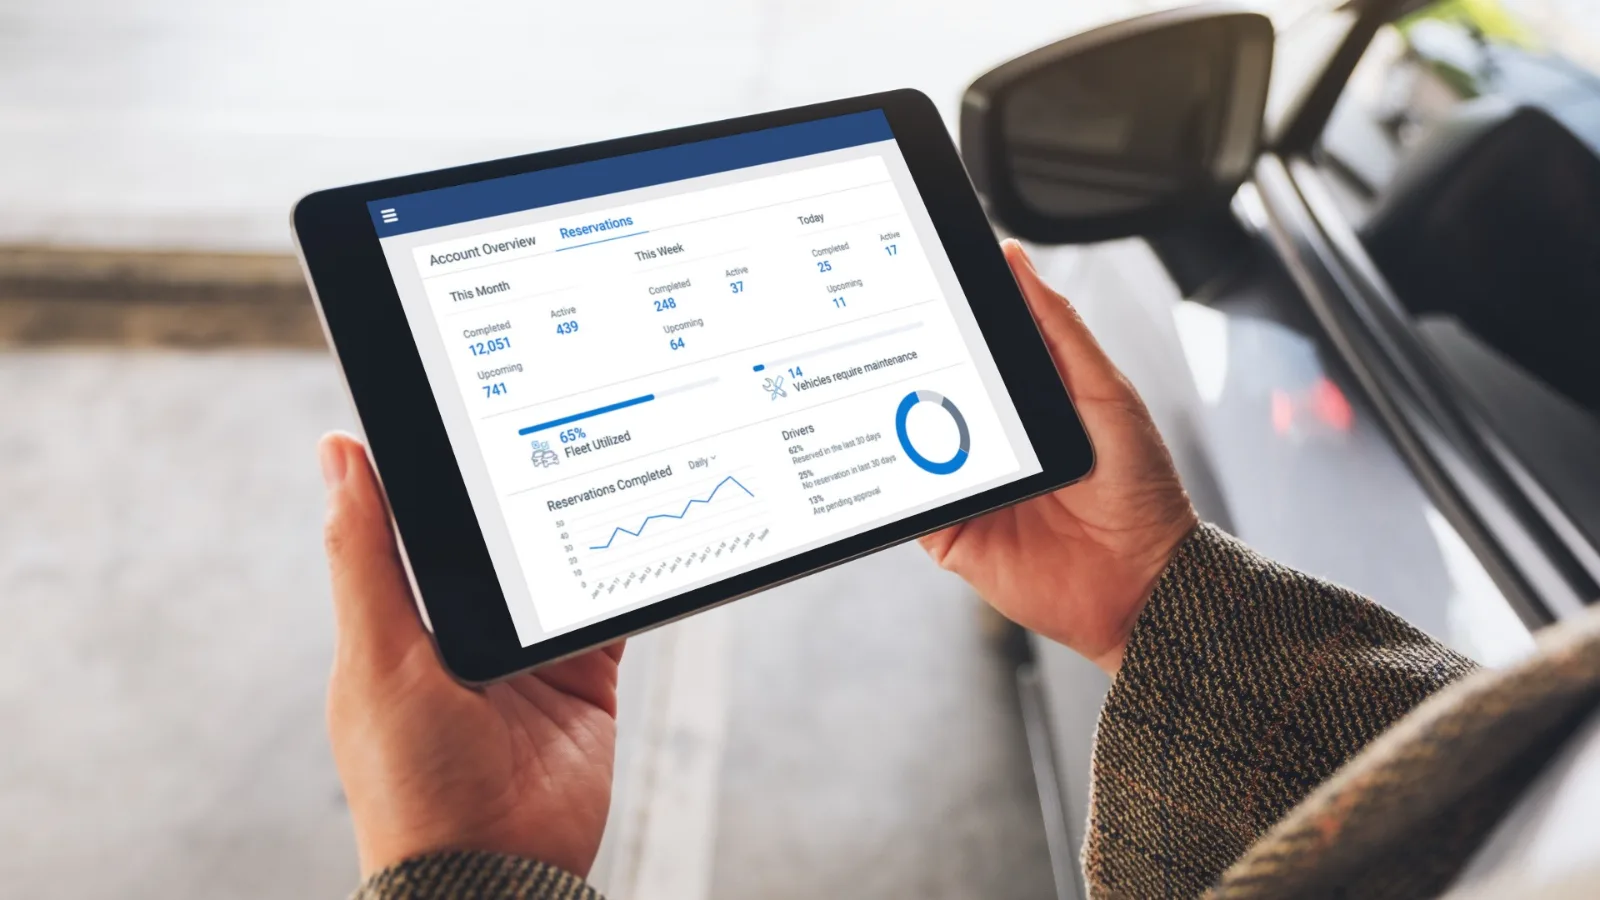
Before the first device ships, we build your groups, zones and rules, and we stay on the phone until every device reports. Our post on the multi-site Geotab rollout walks through how that runs, depot by depot.
Build the Fleet Right-Sizing Case in Five Steps
A right-sizing decision moves faster when the case is built the same way every time. Five steps take it from a hunch to a signed decision:
Put vehicles, trailers and machines in groups by region, depot, department or job, so each number lands on the line that pays for it.
Sort every unit on the metrics above, site by site. The bottom of that list is your short list.
A unit that idles all shift needs coaching; a unit that never starts needs a decision. Preventable idling is split out automatically, so you coach what can change.
Labor, parts, and vendor costs per order roll into per-vehicle history, so repair-versus-replace is arithmetic, and Downtime Detection shows the hours each vehicle was actually unavailable, a real downtime cost per unit. Our post on Geotab fleet maintenance ROI covers that side in full.
Move it, share it, retire it or replace it, with the numbers beside each decision, then schedule the same report so the next budget cycle starts from the same data.
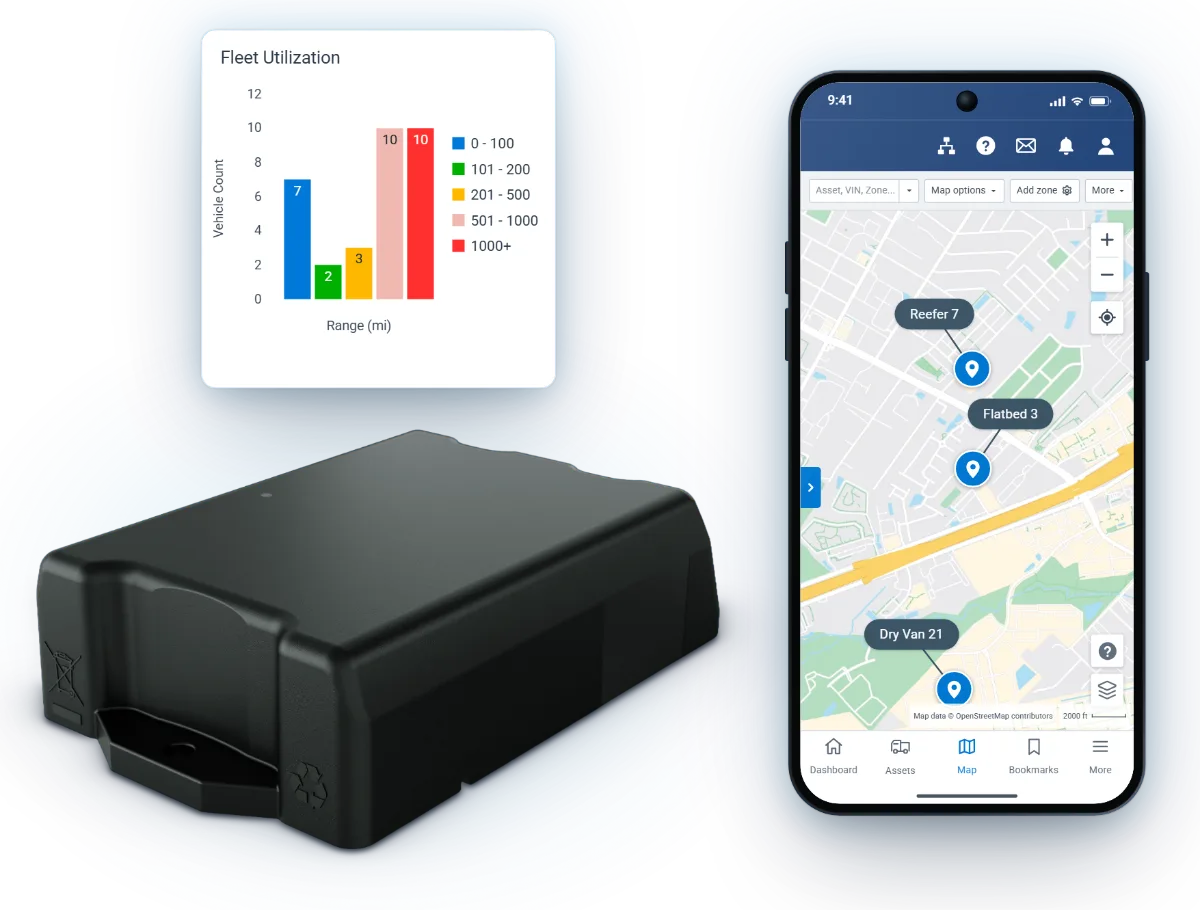
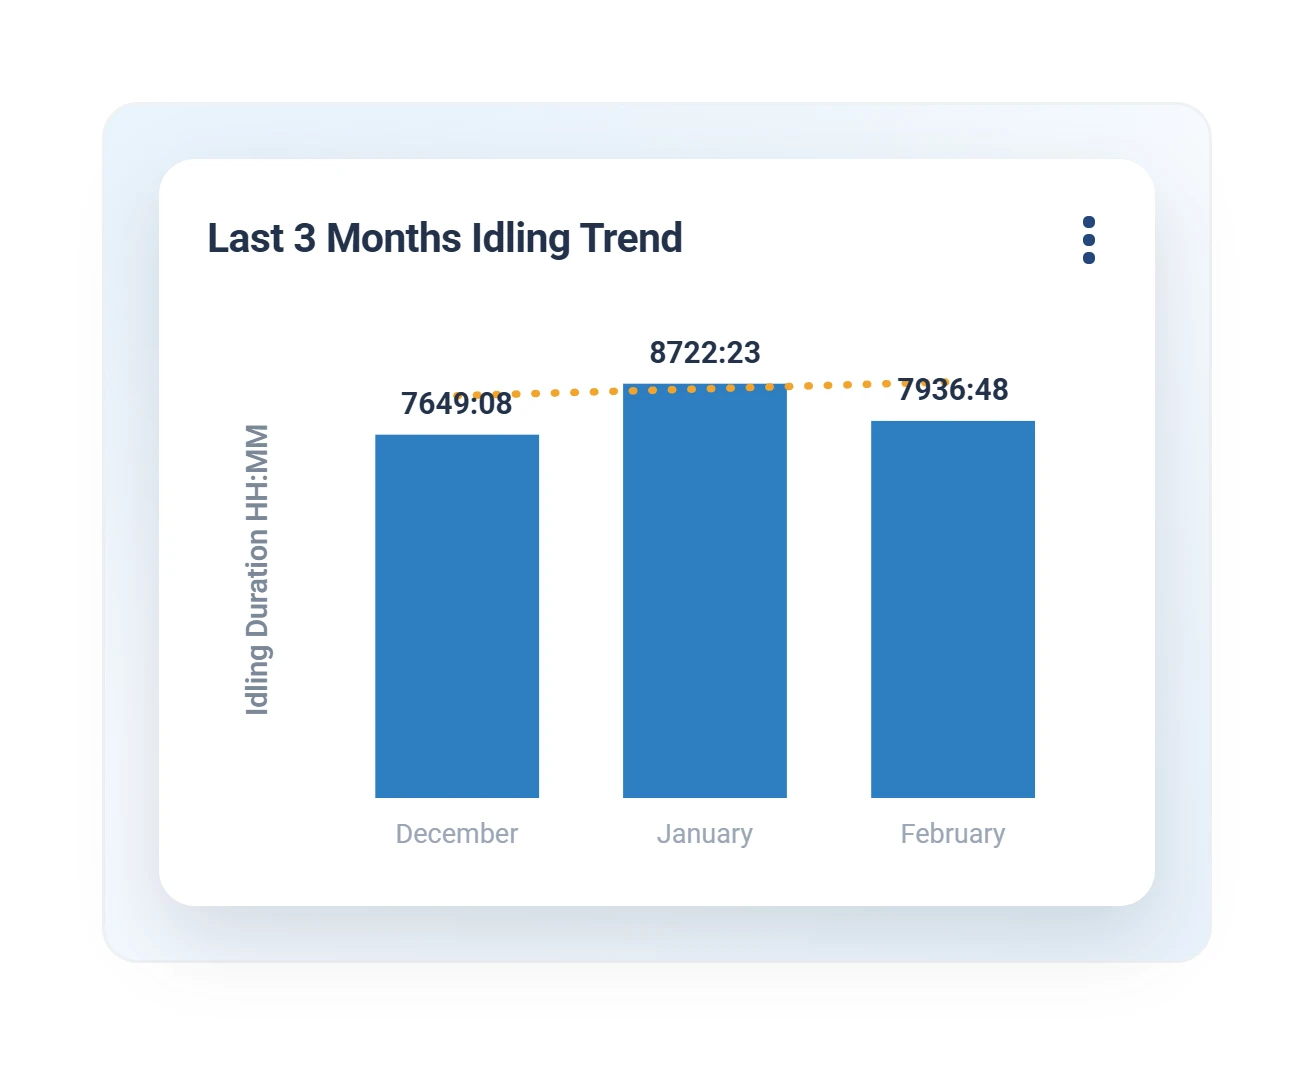
The finished case answers the three questions a CFO or a council asks first: which units, why those, and what happens to each one.
Fleet Utilization Reports for Budget Decisions
Every right-sizing decision needs numbers behind it, whether it goes to a CFO, a board or a city council. Utilization numbers justify every replacement request, and they make the case for retiring a unit just as clearly.
A replacement request with the unit's days used and repair history attached reads very differently from one built on age and mileage alone.
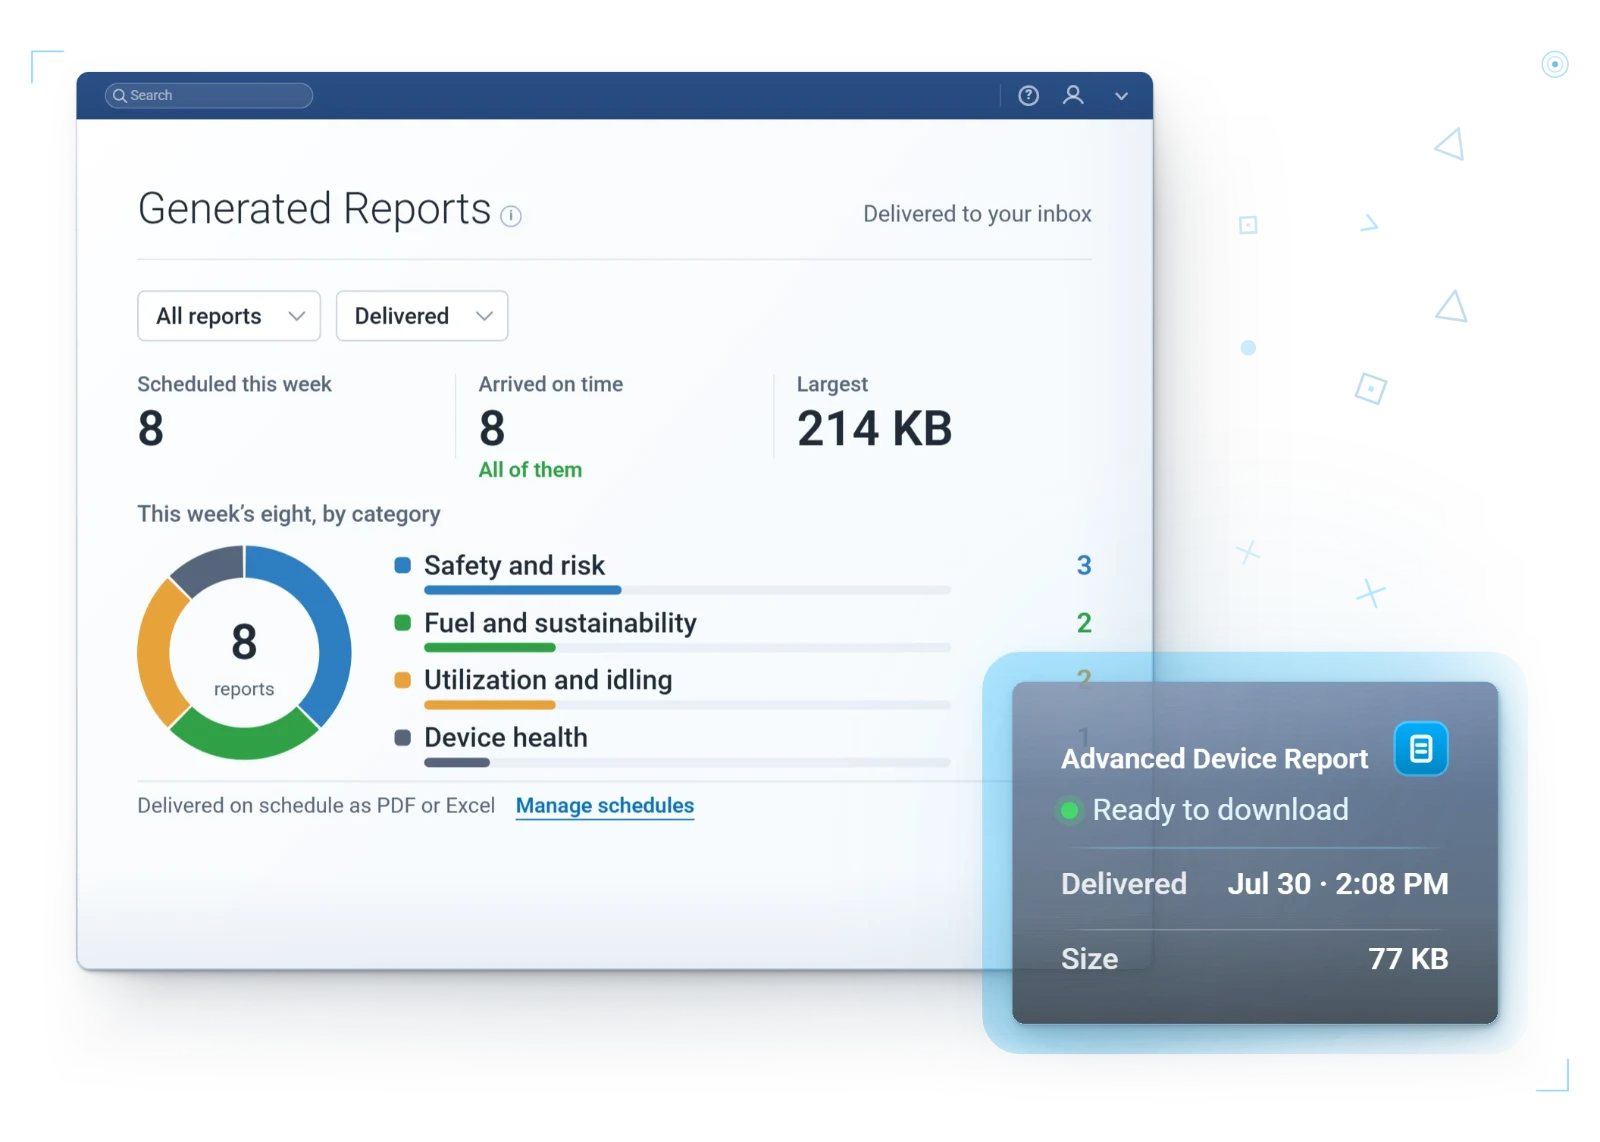
Geotab Scheduled Reports email utilization by site, department or asset type daily, weekly or monthly, so the people who sign off see the same numbers your fleet team sees. Leadership gets the roll-up across every site, and each manager sees their own group. Waldinger Corporation describes what that visibility turned up:
“This has provided new insight into asset utilization, fleet waste, and has dramatically improved employee safety. Truly unbelievable.”Waldinger Corporation, Des Moines, IA
The same platform scales from one yard to every region you run. Public agencies can buy through Sourcewell contract 102924-GEO, valid through April 2029, with cameras and asset trackers on contract (Sourcewell, 2025).
Fleet Right-Sizing Mistakes That Hide the Return
Measuring utilization is the start. These mistakes hide the rest of the return:
- Measuring only the trucks. Trailers and machines stay off the report, so the rental line never gets questioned. Put trailers on GO Anywhere and heavy equipment on GO Rugged, in the same report as the vehicles.
- Reading one fleet-wide average. An average blends the depot that runs short with the depot that has units to spare. Break every number out by group.
- Reading a messy account. One vehicle filed in the wrong group makes one site look short and another look padded. Clean up the groups first, then read the numbers.
- Deciding on age alone. The oldest unit is not always the one to move. Put utilization and per-vehicle cost side by side, and the right candidate shows itself.
See Your Own Fleet Utilization With a Free Demo
The fastest way to find what your fleet is not using is to measure it. Start with a free demo device on your own vehicles: we configure it before it ships, and it ships within 72 hours. Put it on the vehicle you suspect sits the most, and let the numbers settle the argument.
Vehicle trackers ship Plug-N-Play, so your own crew installs them, with no installer to schedule and zero downtime. Our dedicated U.S.-based team answers in minutes, we have served fleets since 1999, and once you sign, the Fixed Pricing Guarantee locks your price for the rest of the contract.
Keep it only if the numbers convince you.
FAQ
What is fleet utilization?
Fleet utilization is how much each vehicle and piece of equipment actually works, measured against the time it sits. It is counted per unit in days used, hours used, distance and idle time, so the units that sit show up by name.
How does Geotab help with fleet right-sizing?
Geotab shows which vehicles, trailers and machines sit, by asset and by site, so you move, share or retire them before you buy or rent more. Every site reads from the same MyGeotab account, so a unit parked at one depot can fill a gap at another.
How do we measure utilization on trailers with no engine?
By movement and time parked. GO Anywhere reports hourly location for up to 10 years on a single battery, with nothing to wire or recharge. Utilization rolls up per asset, and dwell-time alerts flag the trailers sitting idle too long.
Which MyGeotab reports show fleet utilization?
The Asset Utilization page and the utilization report. Between them they show days used, hours used, distance, idle versus drive time and idle-only days for every asset, and Scheduled Reports email the results by site, department or asset type.
How do we decide whether to retire an underused vehicle?
Decide on two numbers together: how much the unit works and what it costs to keep. Days used and idle versus drive time show the first; labor, parts, and vendor costs per order roll into per-vehicle history, so repair-versus-replace is arithmetic. If another site needs the unit, move it before you retire it.
Where should our free demo device go to test fleet utilization?
On the vehicle you suspect sits the most. We configure your demo device before it ships, and it ships within 72 hours, so the days used and idle time you judge come from your own fleet.