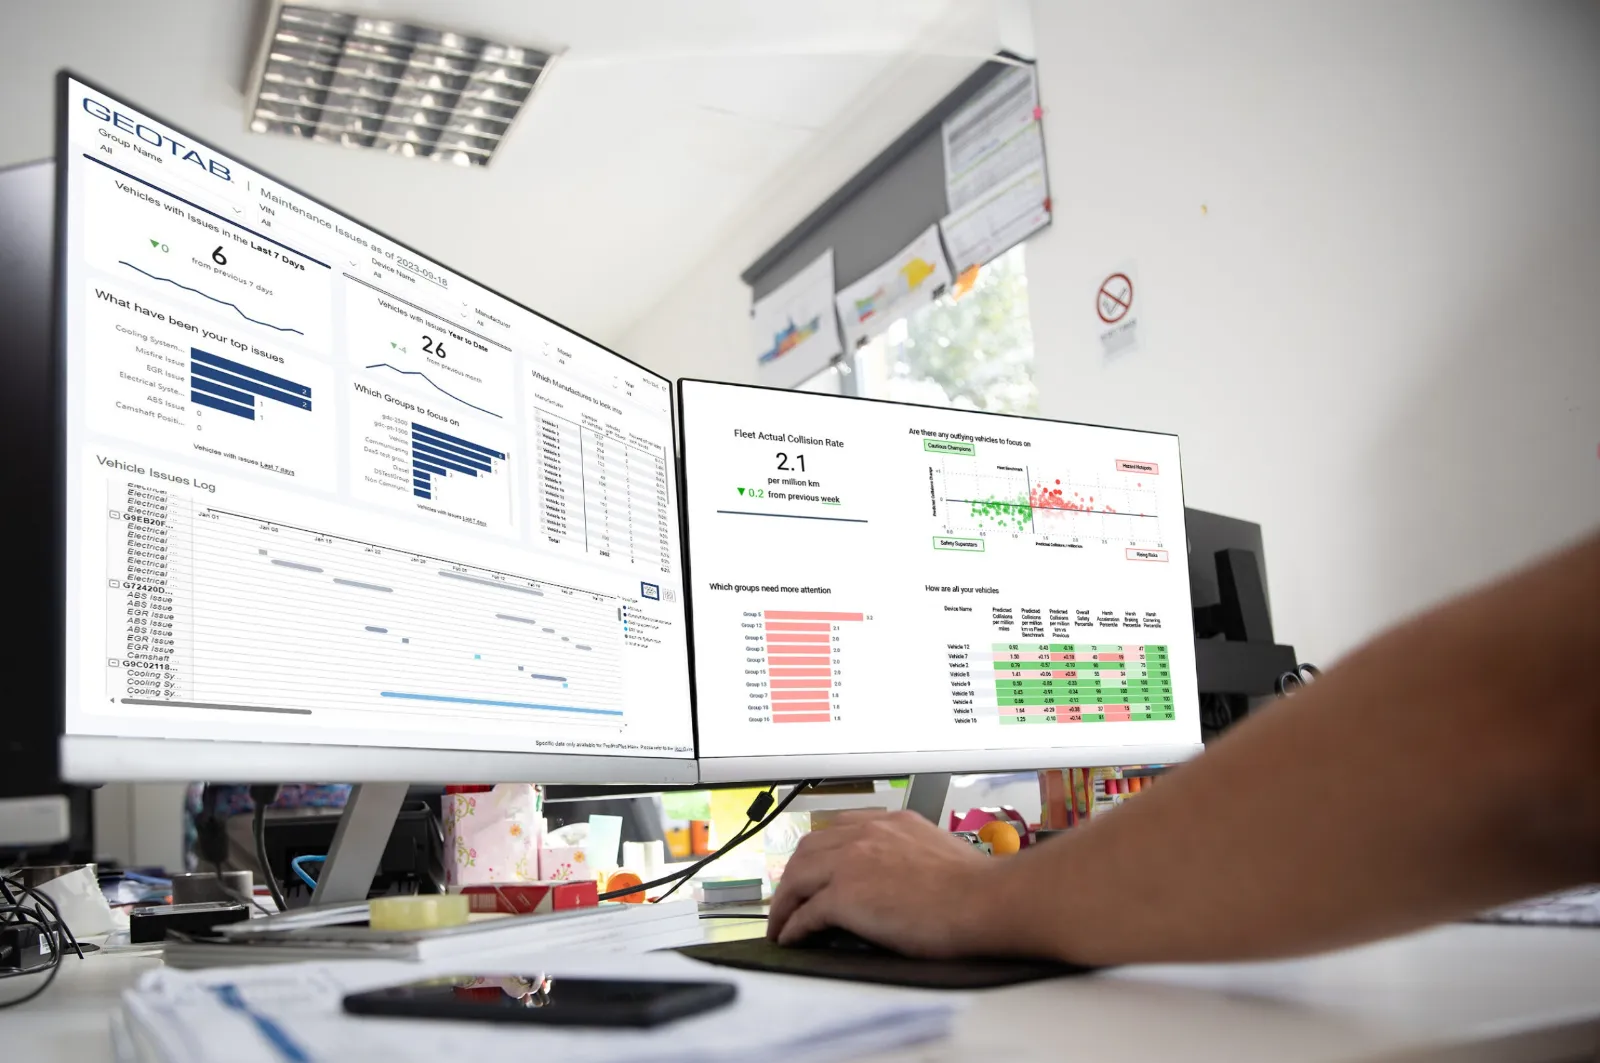
When fleet data meets your dashboards

Your fleet data, in your BI tools

Send curated fleet metrics into the dashboards your leadership already uses.

  • Direct feeds into common BI tools
  • Curated, analysis-ready fleet metrics
  • Blend fleet data with your business data
Geotab OEM and third-party data integration

Analytics

Geotab Data Connector: stop exporting, start connecting

Live feeds replace the monthly CSV shuffle.

BI-ready data feeds

Fleet KPIs flow into your BI tool automatically, on a schedule.

Curated metrics

Safety, utilization, idling, and maintenance measures, pre-shaped for analysis.

Blended reporting

Put cost-per-stop next to revenue-per-stop and see the whole picture.

Always current

Dashboards update themselves, no manual refresh cycle.

What Changes

What your fleet gets out of it

One version of the truth

Everyone reports from the same live numbers.

Deeper questions answered

Fleet data joins the rest of the business story.

Analyst time back

No more building the same export every month.

What Actually Flows

Five curated datasets, not a raw dump

Most large companies still run reporting out of spreadsheets (62%, Deloitte, 2022). Geotab Data Connector delivers analysis-ready tables instead, pre-aggregated so your BI tool is not grinding through raw GPS points.

Vehicle KPI

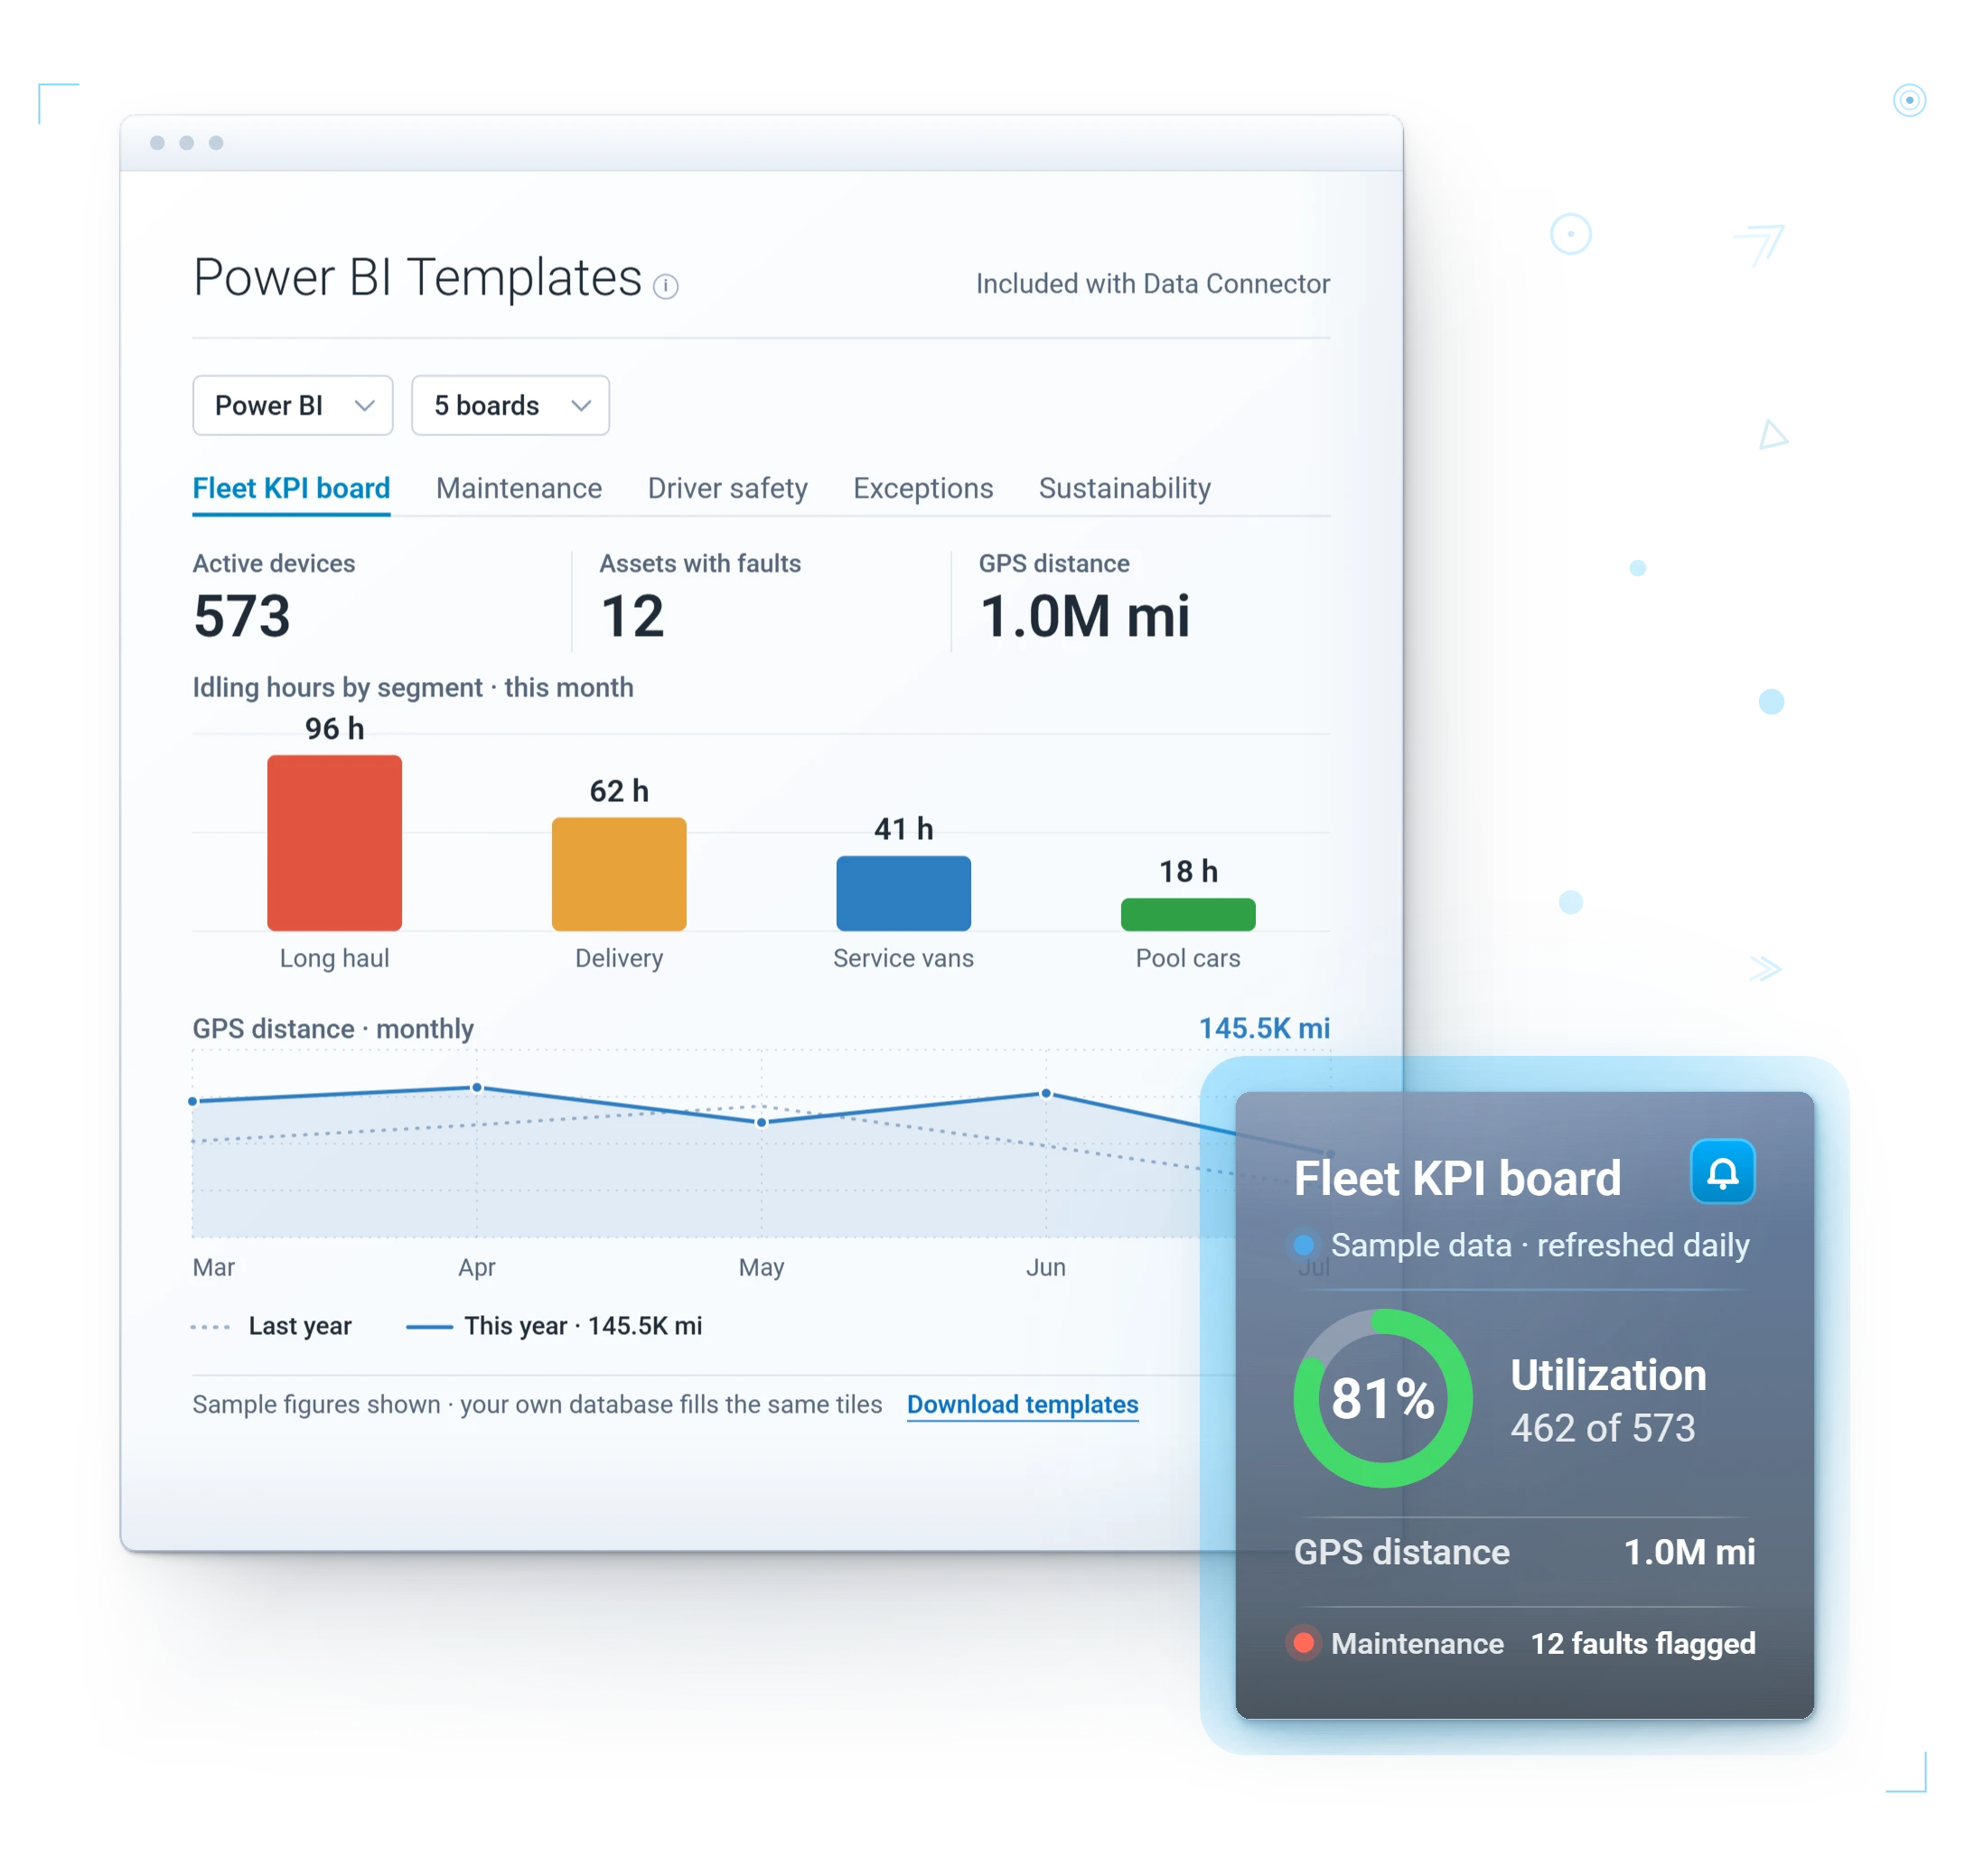
Utilization, fuel, fuel economy, fault counts, odometer, device health, aggregated hourly, daily, and monthly.

Vehicle Metadata

VIN, make, model, year, vocation, refreshed daily.

Vehicle Groups

Your MyGeotab group structure, refreshed hourly, so dashboards slice by the same regions and teams the fleet already uses.

Predictive Safety and Benchmarking

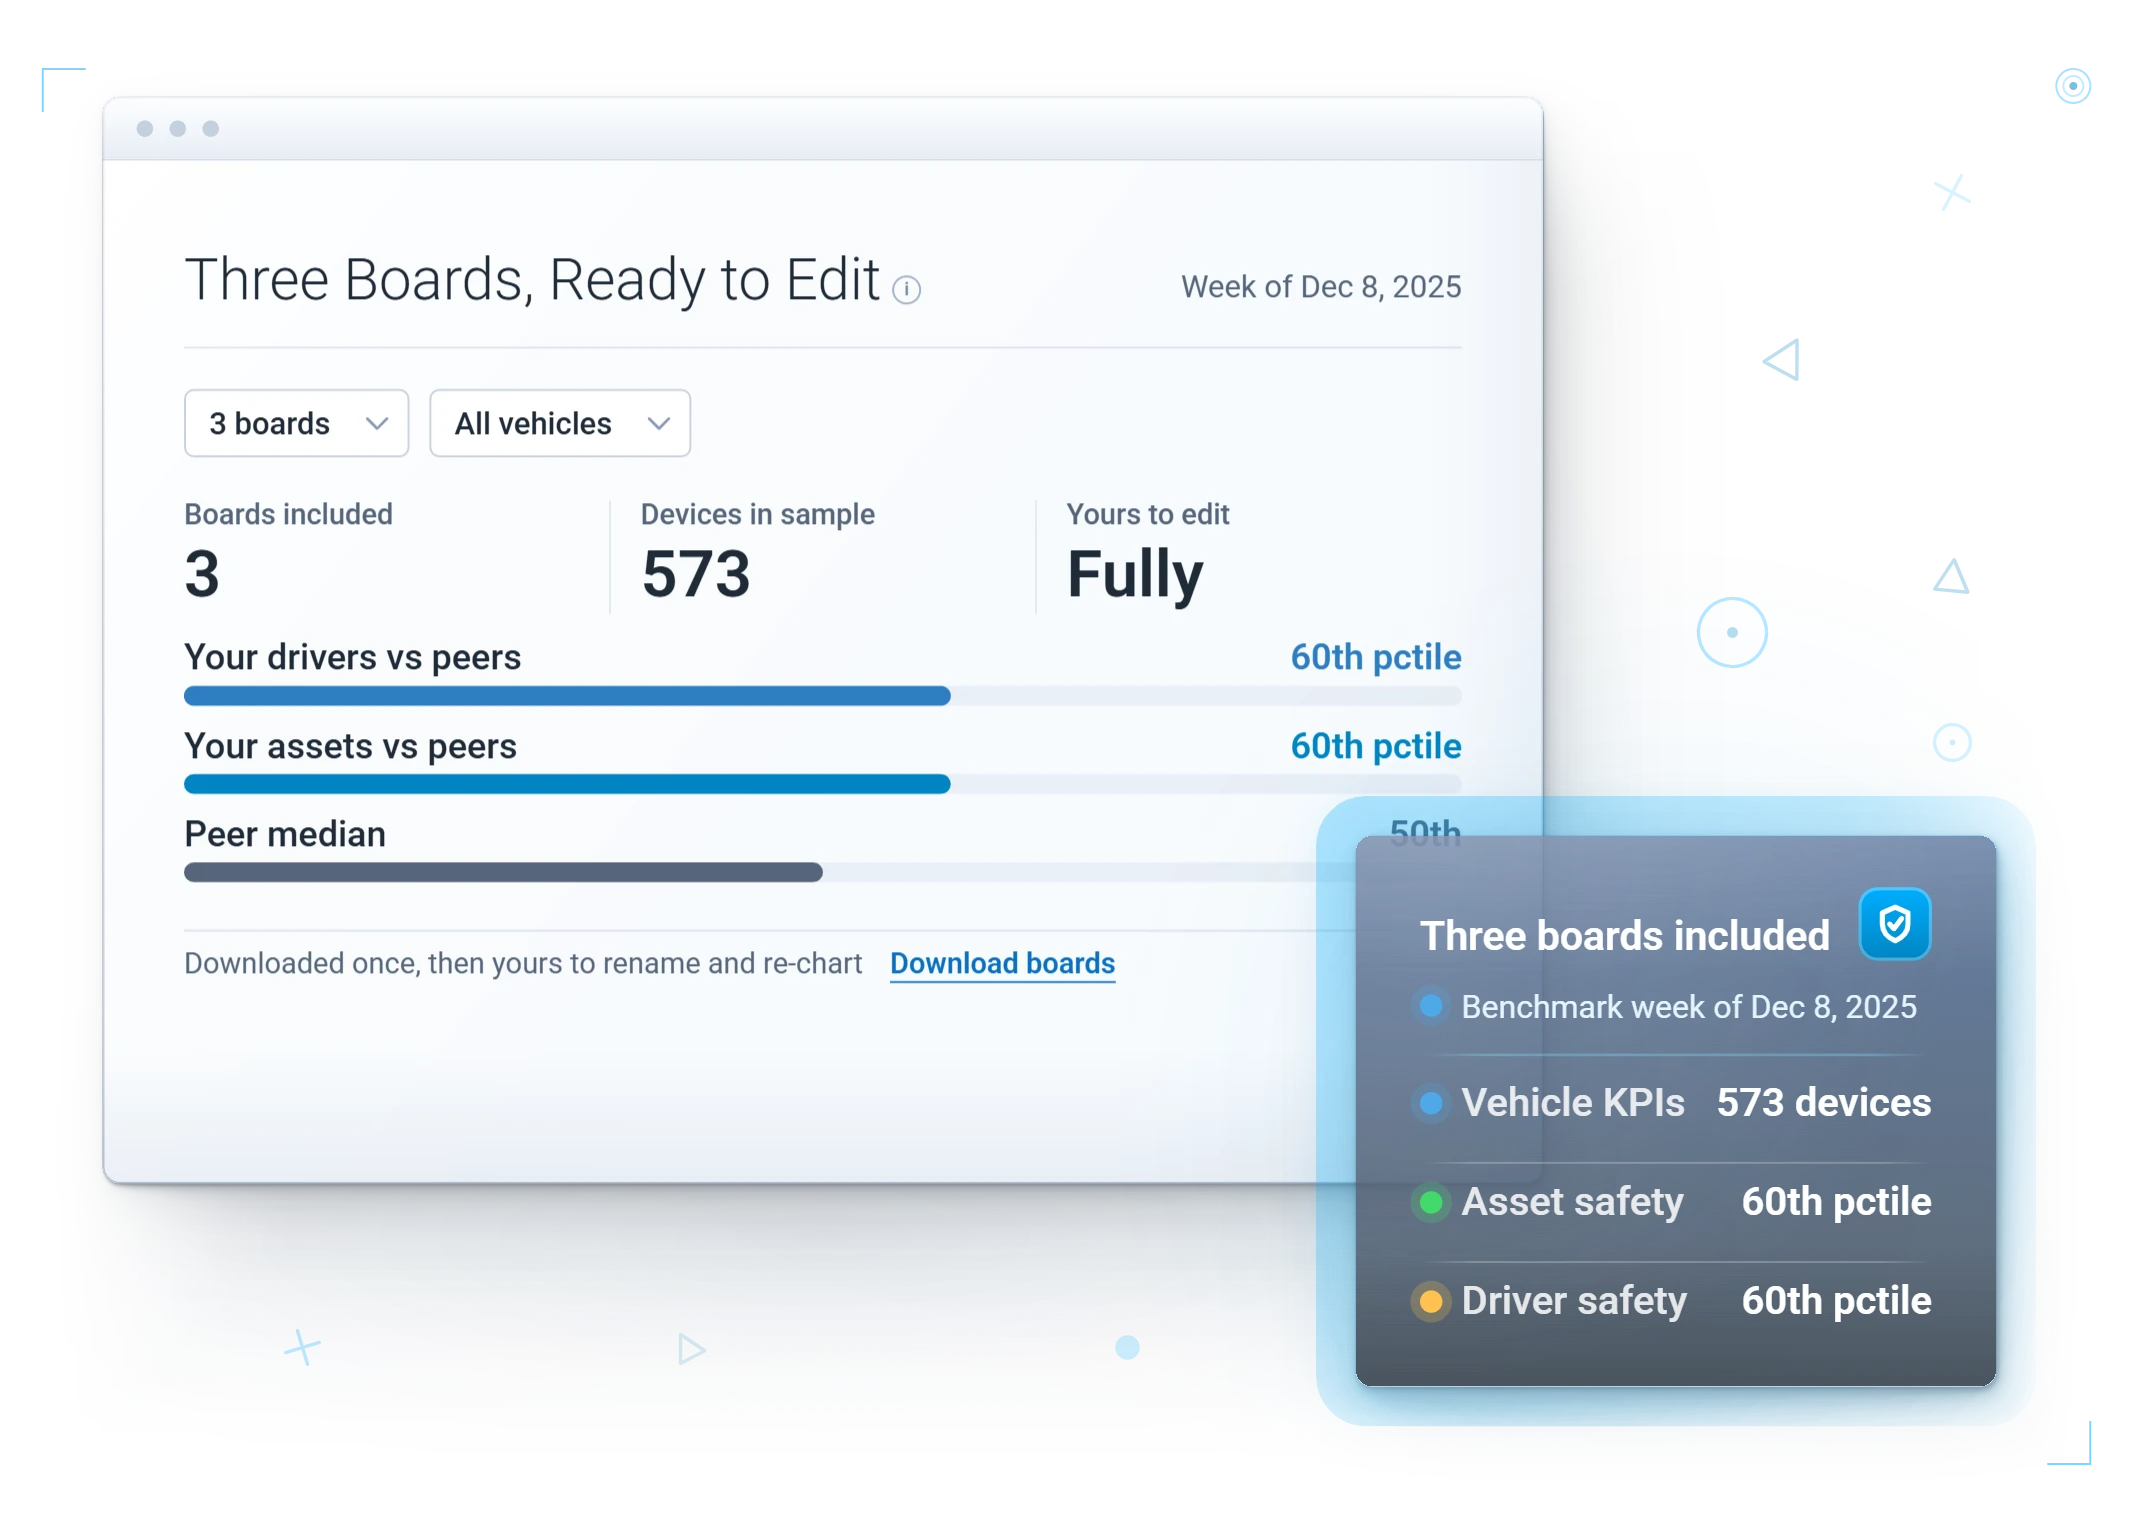
Predicted collision rate per million miles at fleet and vehicle level, plus rank and percentile against peer fleets.

Maintenance Insights

Maintenance-related signals like Electrical System Ratings, water-in-fuel, ABS, and engine coolant issues, with daily status and historical trends.

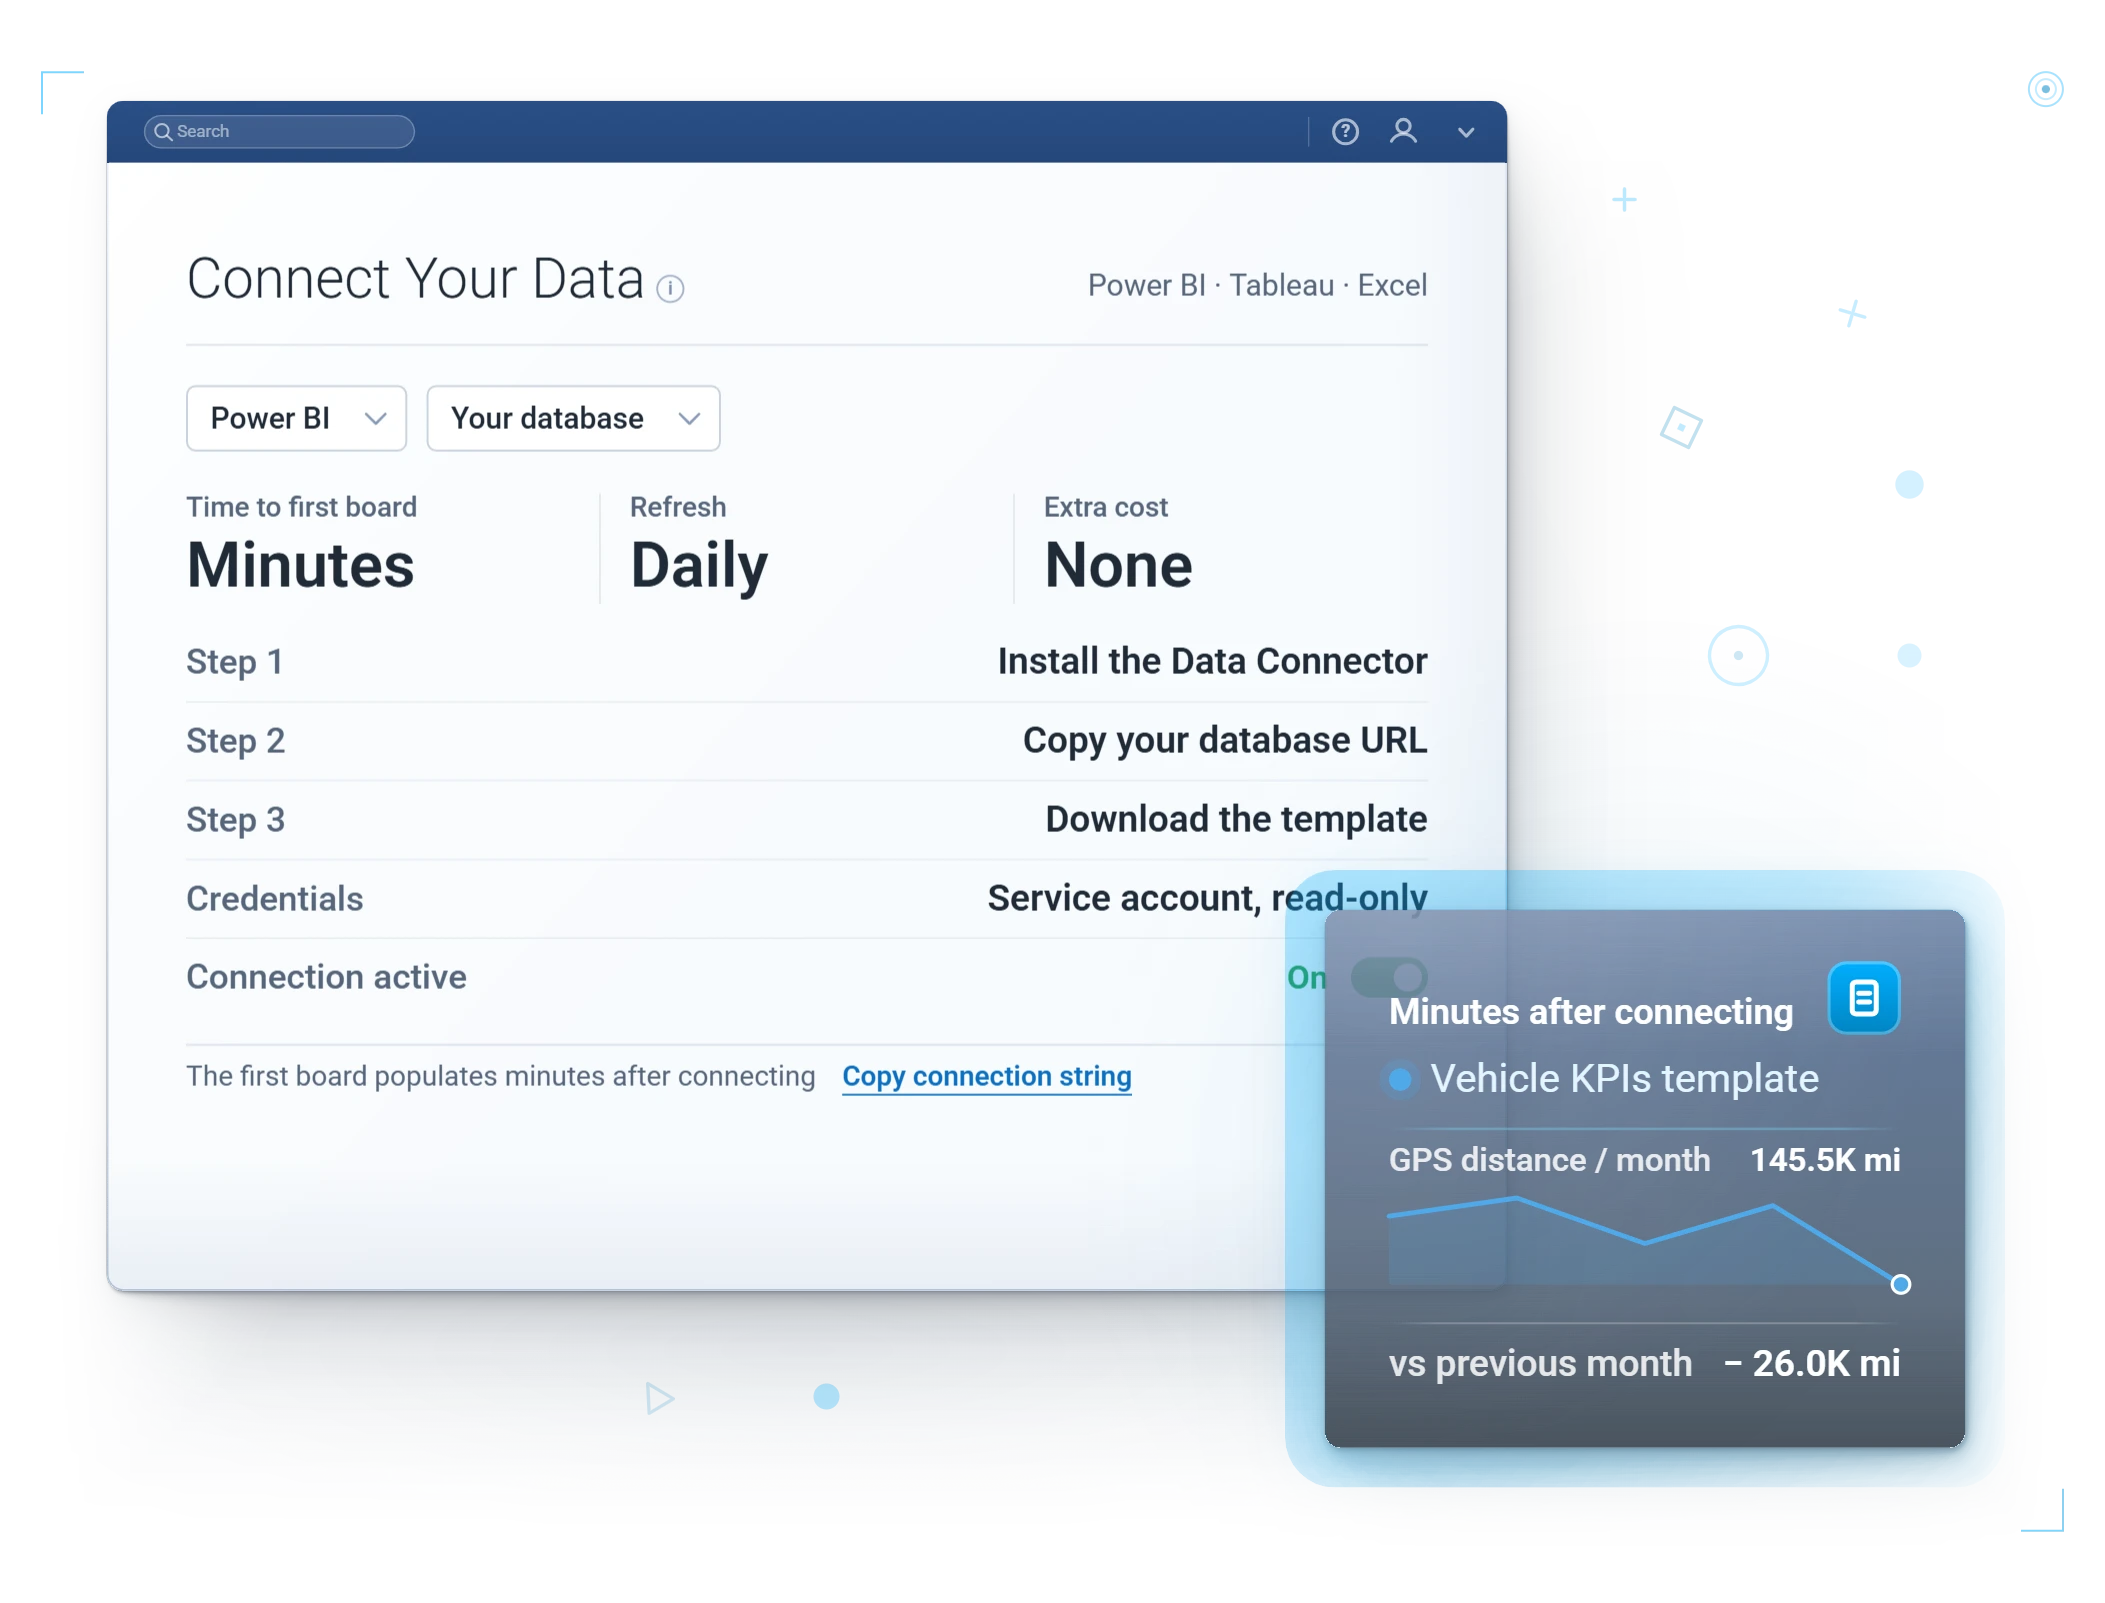
Templates you open, not build. Out-of-the-box templates for Power BI, Tableau, and Excel. Start from one Monday, make it yours by Friday.

A live feed keeps everyday fleet decisions running on current numbers instead of memory. For the one-off questions in between, there is Geotab ACE.

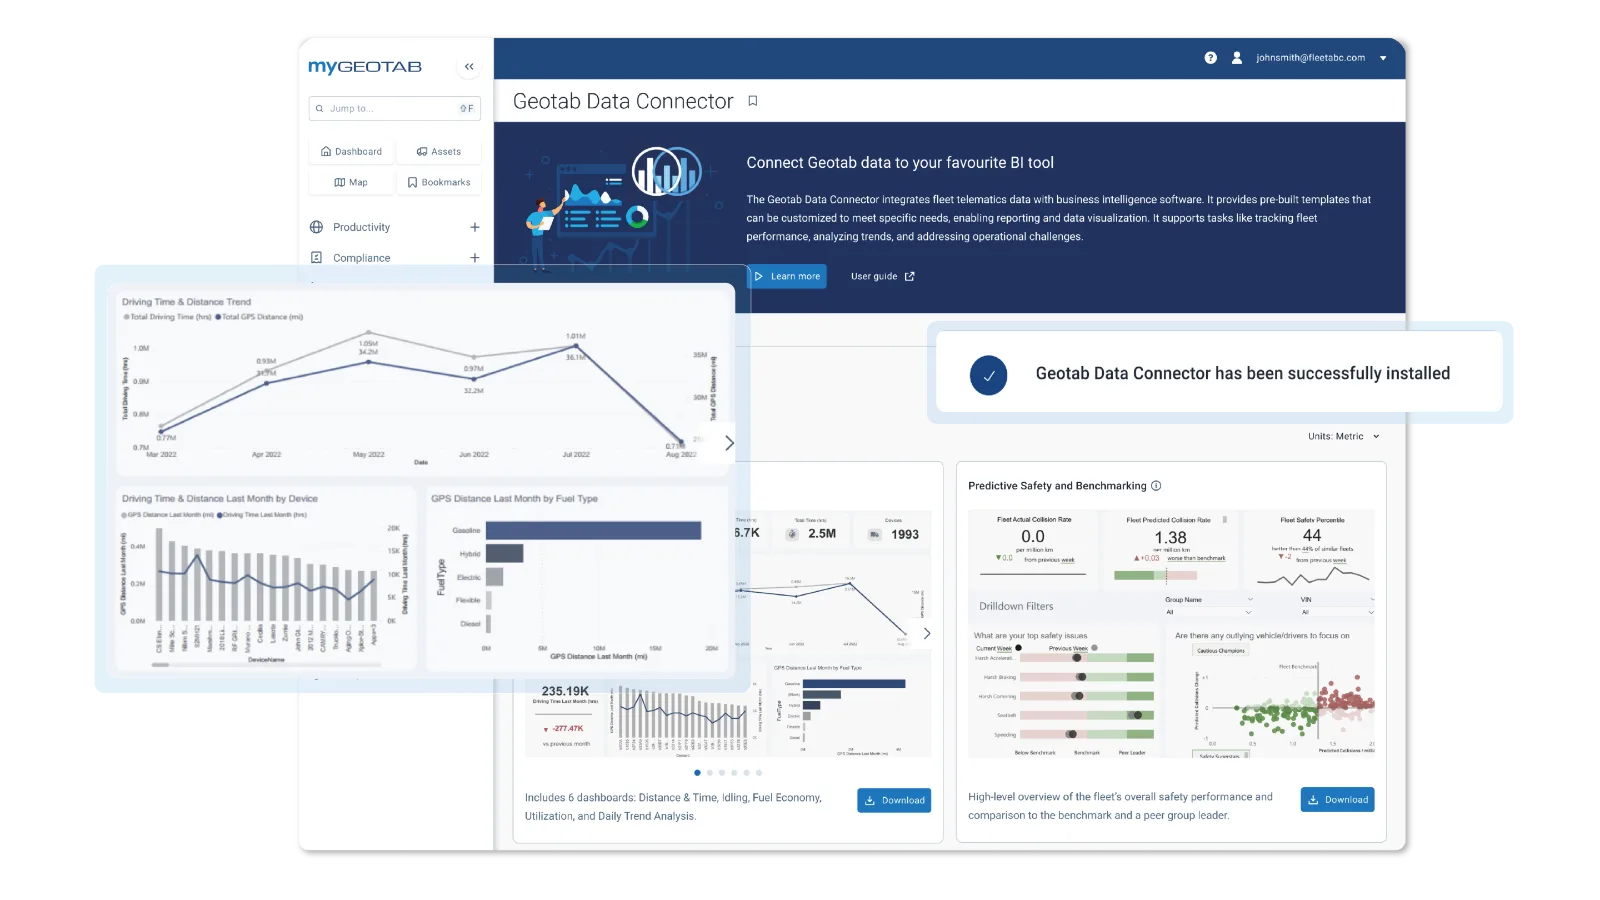
Geotab Data Connector feeding fleet KPIs into BI dashboards

In Your BI Tool

Fleet tables where your analysts live

Analysts join fleet KPIs to the revenue, payroll, and route data they already model, so cost-per-stop and utilization sit in the dashboards leadership opens every morning.

Enterprise Trust

Fleet data you can pipe into BI with confidence

The platform behind the feed meets the security and governance bar your IT team already holds vendors to.

FedRAMP Authorized platform

MyGeotab is FedRAMP Authorized, the security bar US government fleets require (Geotab).

ISO 27001 certified

Geotab's information security management is independently certified to ISO 27001 (Geotab).

FIPS 140-3 encryption

GO device data is protected by encryption validated to FIPS 140-3 (cert #4875) (Geotab).

Governed by your roles

The feed inherits MyGeotab credentials and group structure, so an analyst sees only what their role allows.

Your data stays yours

Curated tables flow to your BI tool while the underlying fleet data stays yours to keep, audit, and export.

Nothing custom to maintain

Point your BI tool at a structured feed, with no integration to build or keep alive.

Questions

Data Connector FAQ

What is the Data Connector?

It sends your fleet data into the business intelligence tools your company already uses, for deeper analysis.

Do I need to build integrations myself?

No. The connector provides a structured feed you can point your BI tool at.

Can I combine fleet data with other business data?

Yes, that is the point. Blend fleet metrics with the rest of your operational data.

Which BI tools are supported?

Power BI, Tableau, and Excel have native templates in metric and imperial. Anything that can consume the structured feed can use the data.

Is the safety data in the feed the same predictive model as the Safety Center?

Same foundation: the Predictive Safety dataset delivers predicted collision rate per million miles, with peer benchmarking by rank and percentile, ready for your own dashboards.

Who controls what an analyst can see?

MyGeotab does. The connector inherits your existing credentials and group structure, so data access in the BI tool matches data access in the platform.

Put fleet KPIs in the boardroom

Show us your current dashboard and we will connect fleet data to it during your trial.

We reply within one business day. No obligation, no spam. Prefer to talk? (877) 771-2236